我的输入是一个2D(x,y)的时间序列,表示跟踪软件屏幕上一点的运动。由于存在一些噪声,我想使用卡尔曼滤波器来去除这些噪声。请问是否有人能为我提供Python代码实现卡尔曼2D滤波器?
在Scipy Cookbook中,我只找到了一个1D的示例:http://www.scipy.org/Cookbook/KalmanFiltering
我看到OpenCV中有卡尔曼滤波器的实现,但是找不到代码示例。谢谢!
我的输入是一个2D(x,y)的时间序列,表示跟踪软件屏幕上一点的运动。由于存在一些噪声,我想使用卡尔曼滤波器来去除这些噪声。请问是否有人能为我提供Python代码实现卡尔曼2D滤波器?
在Scipy Cookbook中,我只找到了一个1D的示例:http://www.scipy.org/Cookbook/KalmanFiltering
我看到OpenCV中有卡尔曼滤波器的实现,但是找不到代码示例。谢谢!
Q非常小时,才会影响数值稳定性。在现实生活中,噪声通常不小,因此幸运的是(至少对于我的实现),在实践中数字不稳定性并不会显现。)kalman_xy假设状态向量为4元组:2个位置数和2个速度数。矩阵F和H已经针对该状态向量进行了定义:如果x是4元组状态,则new_x = F * x
position = H * x
kalman,这是广义卡尔曼滤波器。它的通用性在于,如果您想定义不同的状态向量,例如表示位置、速度和加速度的6元组,它仍然很有用。您只需通过提供适当的F和H来定义运动方程即可。import numpy as np
import matplotlib.pyplot as plt
def kalman_xy(x, P, measurement, R,
motion = np.matrix('0. 0. 0. 0.').T,
Q = np.matrix(np.eye(4))):
"""
Parameters:
x: initial state 4-tuple of location and velocity: (x0, x1, x0_dot, x1_dot)
P: initial uncertainty convariance matrix
measurement: observed position
R: measurement noise
motion: external motion added to state vector x
Q: motion noise (same shape as P)
"""
return kalman(x, P, measurement, R, motion, Q,
F = np.matrix('''
1. 0. 1. 0.;
0. 1. 0. 1.;
0. 0. 1. 0.;
0. 0. 0. 1.
'''),
H = np.matrix('''
1. 0. 0. 0.;
0. 1. 0. 0.'''))
def kalman(x, P, measurement, R, motion, Q, F, H):
'''
Parameters:
x: initial state
P: initial uncertainty convariance matrix
measurement: observed position (same shape as H*x)
R: measurement noise (same shape as H)
motion: external motion added to state vector x
Q: motion noise (same shape as P)
F: next state function: x_prime = F*x
H: measurement function: position = H*x
Return: the updated and predicted new values for (x, P)
See also http://en.wikipedia.org/wiki/Kalman_filter
This version of kalman can be applied to many different situations by
appropriately defining F and H
'''
# UPDATE x, P based on measurement m
# distance between measured and current position-belief
y = np.matrix(measurement).T - H * x
S = H * P * H.T + R # residual convariance
K = P * H.T * S.I # Kalman gain
x = x + K*y
I = np.matrix(np.eye(F.shape[0])) # identity matrix
P = (I - K*H)*P
# PREDICT x, P based on motion
x = F*x + motion
P = F*P*F.T + Q
return x, P
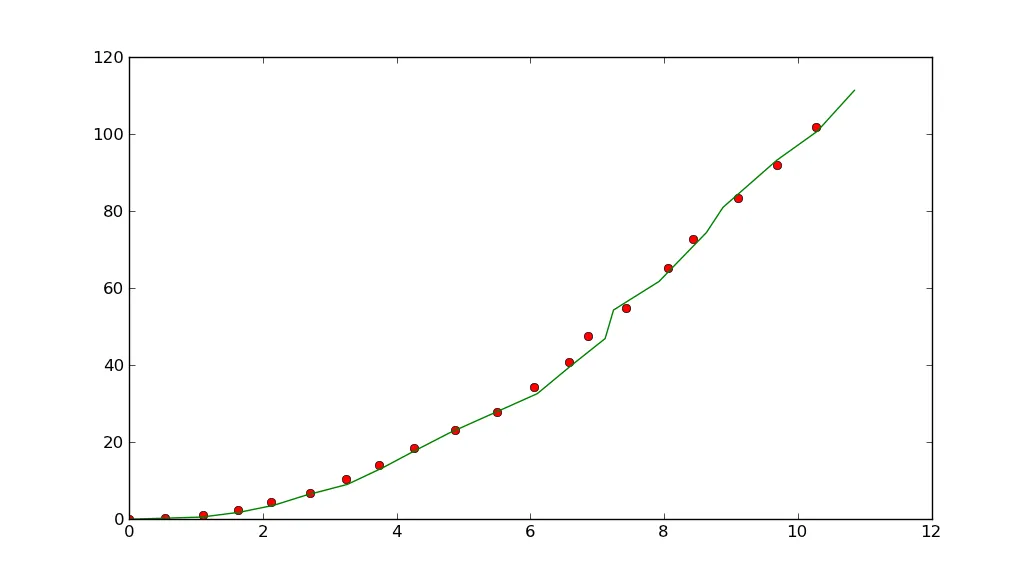
def demo_kalman_xy():
x = np.matrix('0. 0. 0. 0.').T
P = np.matrix(np.eye(4))*1000 # initial uncertainty
N = 20
true_x = np.linspace(0.0, 10.0, N)
true_y = true_x**2
observed_x = true_x + 0.05*np.random.random(N)*true_x
observed_y = true_y + 0.05*np.random.random(N)*true_y
plt.plot(observed_x, observed_y, 'ro')
result = []
R = 0.01**2
for meas in zip(observed_x, observed_y):
x, P = kalman_xy(x, P, meas, R)
result.append((x[:2]).tolist())
kalman_x, kalman_y = zip(*result)
plt.plot(kalman_x, kalman_y, 'g-')
plt.show()
demo_kalman_xy()
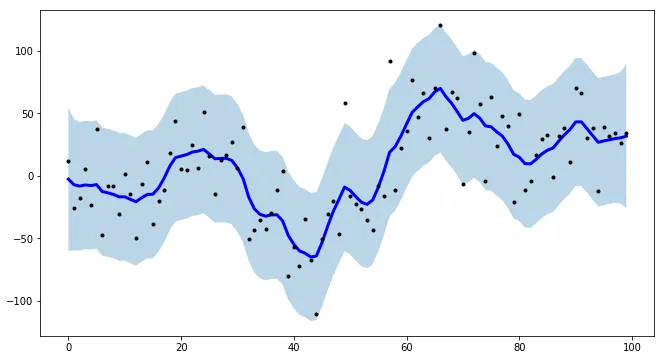
P = np.matrix(np.eye(4))*1000。为什么要乘以1000? - Sophiademo_kalman_xy()中,R应该是一个2x2(测量噪声协方差)矩阵,例如R = np.matrix([[r,0], [0,r]])。在kalman_xy()中,Q的默认值也可能太高,以至于很难看到调整R的效果。 - hyperspasmKalmanSmoother的情况下,您可以将不同的组件(水平、趋势、季节性、长期季节性)组合在一起对曲线进行平滑处理。import numpy as np
import matplotlib.pyplot as plt
from tsmoothie.smoother import *
from tsmoothie.utils_func import sim_randomwalk
# generate 3 randomwalks timeseries of lenght 100
np.random.seed(123)
data = sim_randomwalk(n_series=3, timesteps=100,
process_noise=10, measure_noise=30)
# operate smoothing
smoother = KalmanSmoother(component='level_trend',
component_noise={'level':0.1, 'trend':0.1})
smoother.smooth(data)
# generate intervals
low, up = smoother.get_intervals('kalman_interval', confidence=0.05)
# plot the first smoothed timeseries with intervals
plt.figure(figsize=(11,6))
plt.plot(smoother.smooth_data[0], linewidth=3, color='blue')
plt.plot(smoother.data[0], '.k')
plt.fill_between(range(len(smoother.data[0])), low[0], up[0], alpha=0.3)