很不幸,看起来
来源中的数据“物化”方面是硬编码的。虽然该函数并不那么复杂,但你可以自己制作一个版本。老实说,如果你的总N仍然可控,我可能会只做
data = np.array(data); expanded_data = np.repeat(data[:,0], data[:,1])尽管效率低下,因为生命苦短。
另一种选择是使用pomegranate,它支持传递权重:
import numpy as np
import scipy.stats
import matplotlib.pyplot as plt
import pomegranate as pg
data = [(1, 34), (2, 1023), (3, 3243), (4, 879), (5, 202), (6, 10)]
data = np.array(data)
expanded = np.repeat(data[:,0], data[:,1].astype(int))
scipy_shape, _, scipy_scale = scipy_params = scipy.stats.lognorm.fit(expanded, floc=0)
scipy_sigma, scipy_mu = scipy_shape, np.log(scipy_scale)
pg_dist = pg.LogNormalDistribution(0, 1)
pg_dist.fit(data[:,0], weights=data[:,1])
pg_mu, pg_sigma = pg_dist.parameters
fig = plt.figure()
ax = fig.add_subplot(111)
x = np.linspace(0.1, 10, 100)
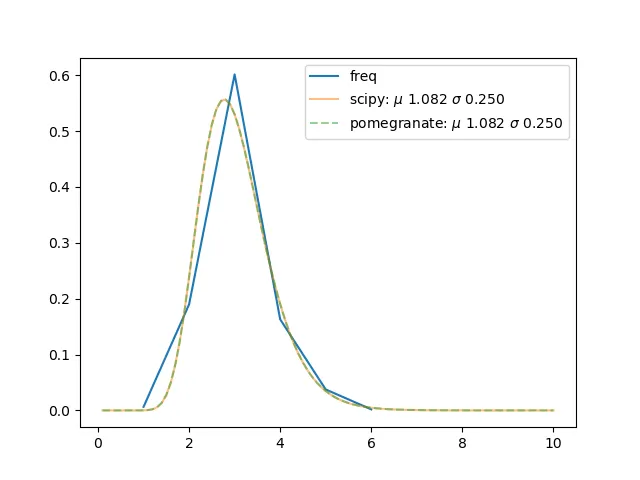
ax.plot(data[:,0], data[:, 1] / data[:,1].sum(), label="freq")
ax.plot(x, scipy.stats.lognorm(*scipy_params).pdf(x),
label=r"scipy: $\mu$ {:1.3f} $\sigma$ {:1.3f}".format(scipy_mu, scipy_sigma), alpha=0.5)
ax.plot(x, pg_dist.probability(x),
label=r"pomegranate: $\mu$ {:1.3f} $\sigma$ {:1.3f}".format(pg_mu, pg_sigma), linestyle='--', alpha=0.5)
ax.legend(loc='upper right')
fig.savefig("compare.png")
给我