我有一个数据集,我知道它服从帕累托分布。请问有人能指点我如何在Scipy中拟合这个数据集吗?我运行了下面的代码,但我不知道返回给我的是什么(a、b、c)。此外,在获得a、b、c之后,我该如何使用它们计算方差?
import scipy.stats as ss
import scipy as sp

a,b,c=ss.pareto.fit(data)
我有一个数据集,我知道它服从帕累托分布。请问有人能指点我如何在Scipy中拟合这个数据集吗?我运行了下面的代码,但我不知道返回给我的是什么(a、b、c)。此外,在获得a、b、c之后,我该如何使用它们计算方差?
import scipy.stats as ss
import scipy as sp
a,b,c=ss.pareto.fit(data)
在拟合幂律函数时一定要非常小心!! 许多所报道的幂律函数实际上是错误地拟合成了幂律函数。详见Clauset等人的论文(如果您没有期刊访问权限,论文也在arxiv上)。他们有一个伴随网站链接到Python的实现。不确定是否使用Scipy,因为我最近使用它们的R实现。
这是一个快速编写的版本,参考了Rupert提供的参考页面。目前在scipy和statsmodels中正在进行工作,并需要使用MLE来处理一些固定或冻结的参数,这仅在主干版本中可用。目前还没有参数估计或其他结果统计量的标准误差可用。
'''estimating pareto with 3 parameters (shape, loc, scale) with nested
minimization, MLE inside minimizing Kolmogorov-Smirnov statistic

running some examples looks good
Author: josef-pktd
'''

import numpy as np
from scipy import stats, optimize
#the following adds my frozen fit method to the distributions
#scipy trunk also has a fit method with some parameters fixed.
import scikits.statsmodels.sandbox.stats.distributions_patch

true = (0.5, 10, 1.)   # try different values
shape, loc, scale = true
rvs = stats.pareto.rvs(shape, loc=loc, scale=scale, size=1000)

rvsmin = rvs.min() #for starting value to fmin


def pareto_ks(loc, rvs):
    est = stats.pareto.fit_fr(rvs, 1., frozen=[np.nan, loc, np.nan])
    args = (est[0], loc, est[1])
    return stats.kstest(rvs,'pareto',args)[0]

locest = optimize.fmin(pareto_ks, rvsmin*0.7, (rvs,))
est = stats.pareto.fit_fr(rvs, 1., frozen=[np.nan, locest, np.nan])
args = (est[0], locest[0], est[1])
print 'estimate'
print args
print 'kstest'
print stats.kstest(rvs,'pareto',args)
print 'estimation error', args - np.array(true)
import openturns as ot
data = [
    [2.7018013],
    [8.53280352],
    [1.15643882],
    [1.03359467],
    [1.53152735],
    [32.70434285],
    [12.60709624],
    [2.012235],
    [1.06747063],
    [1.41394096],
]
sample = ot.Sample([[v] for v in data])
distribution = ot.ParetoFactory().build(sample)
当然可以打印它:
print(distribution)
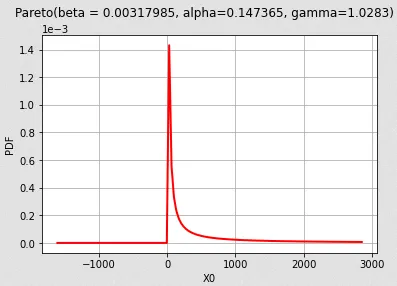
>>> Pareto(beta = 0.00317985, alpha=0.147365, gamma=1.0283)
或绘制其概率密度函数:
from openturns.viewer import View

pdf_graph = distribution.drawPDF()
pdf_graph.setTitle(str(distribution))
View(pdf_graph, add_legend=False)
有关ParetoFactory的更多详细信息,请参阅文档。
distribution = ot.ParetoFactory.build(data)。其次,我收到了一个 TypeError:Wrong number or type of arguments for overloaded function 'ParetoFactory_build'。 看起来 Openturns 库想要一个特定的格式来处理'sample',但我不明白应该如何格式化。 - Tropiliodistribution = ot.ParetoFactory().build(data)。我已经更正了上面的代码。为了被OpenTURNS库理解,样本应该被形状化(大小,维度)。在我的例子中它是(10,1)。 - Jean A.在将数据传递给OPENTURNS中的build()函数之前,请确保按照以下方式进行转换:
data = [[i] for i in data]