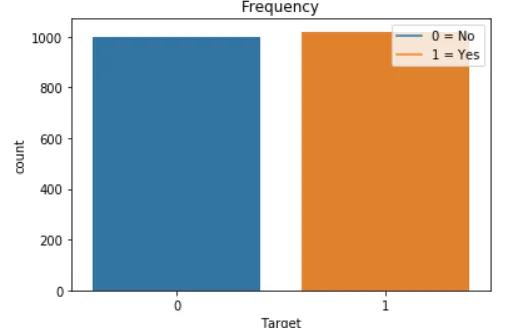
请问我该如何在我的柱状图上显示数量?谢谢。
sns.countplot(data['target'])
plt.plot(0, label ="0 = No")
plt.plot(1, label ="1 = Yes")
plt.xlabel("Target")
plt.ylabel("count")
plt.title("Target vrs count")
plt.legend()
plt.show()
请问我该如何在我的柱状图上显示数量?谢谢。
sns.countplot(data['target'])
plt.plot(0, label ="0 = No")
plt.plot(1, label ="1 = Yes")
plt.xlabel("Target")
plt.ylabel("count")
plt.title("Target vrs count")
plt.legend()
plt.show()
您可以使用matplotlib.text:
from matplotlib import pyplot as plt
data = pd.DataFrame({'target': [1, 1, 1, 0, 0]})
sns.countplot(data.target);
for v in [0, 1]:
    plt.text(v, (data.target == v).sum(), str((data.target == v).sum()));
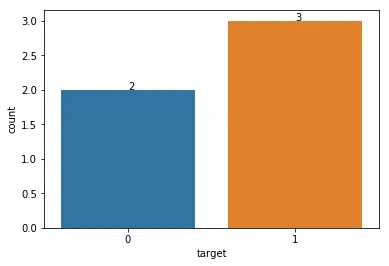
text的模块。尝试使用from matplotlib import pyplot as plt,然后使用plt.text。 - Ami Tavory