这是我的当前代码
values = pd.Series([False, False, True, True])
v_counts = values.value_counts()
fig = plt.figure()
plt.pie(v_counts, labels=v_counts.index, autopct='%.4f', shadow=True);
目前,它只显示百分比(使用autopct)
我想同时展示百分比和实际值(位置无所谓)
这是我的当前代码
values = pd.Series([False, False, True, True])
v_counts = values.value_counts()
fig = plt.figure()
plt.pie(v_counts, labels=v_counts.index, autopct='%.4f', shadow=True);
目前,它只显示百分比(使用autopct)
我想同时展示百分比和实际值(位置无所谓)
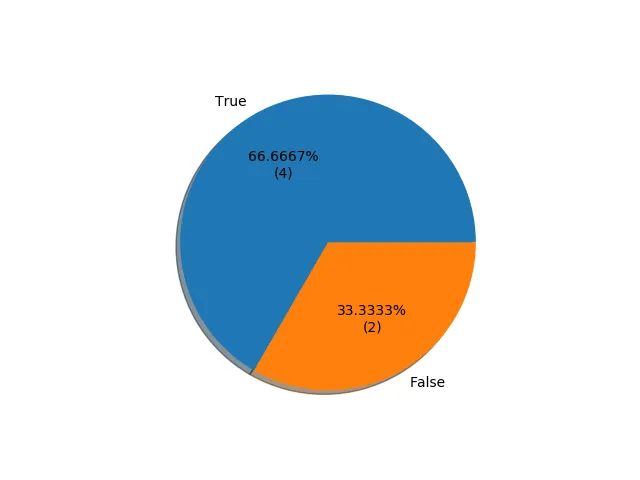
创建您自己的格式化函数。请注意,在该函数中,您必须以某种方式从百分比中重新计算出实际值。
def my_fmt(x):
    print(x)
    return '{:.4f}%\n({:.0f})'.format(x, total*x/100)


values = pd.Series([False, False, True, True, True, True])
v_counts = values.value_counts()
total = len(values)
fig = plt.figure()
plt.pie(v_counts, labels=v_counts.index, autopct=my_fmt, shadow=True);
    def autopct_format(values):
        def my_format(pct):
            total = sum(values)
            val = int(round(pct*total/100.0))
            return '{:.1f}%\n({v:d})'.format(pct, v=val)
        return my_format

plt.pie(mydata,labels = mylabels, autopct=autopct_format(mydata))
这是我的输出结果:
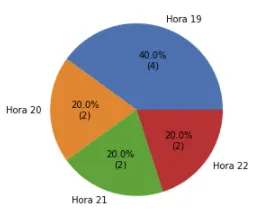
注意:如果你想要更多小数位,只需要在 my_format(pct) 的返回值中改变数字即可。
plt.pie(v_counts, labels=v_counts.index, autopct=autopct_format(values)) - gumption