这个可编译的最小代码片段示例使用JFreeChart作为绘图API,如何使其适应同时显示绝对值和百分比?
我从互联网上的任何代码片段或JFreechart手册中都无法提取此信息。该代码片段生成一个仅显示百分比的饼图。在我的情况下,绝对值也很重要,因此我需要将它们正确地显示在百分比下方。
以下是代码:(注意缺少导入)
我从互联网上的任何代码片段或JFreechart手册中都无法提取此信息。该代码片段生成一个仅显示百分比的饼图。在我的情况下,绝对值也很重要,因此我需要将它们正确地显示在百分比下方。
以下是代码:(注意缺少导入)
public class MyMinimalPieChartExample {
    public static void main(String[] args) {
    DefaultPieDataset dataset = new DefaultPieDataset();
    dataset.setValue("some data 1",99);
    dataset.setValue("some data 2", 77);

    //third adaption
    JFreeChart someChart = ChartFactory.createPieChart(
            "some chart header", dataset,
            true, true, false);
    PiePlot illegalLegalRestPiePlot4 = (PiePlot) someChart.getPlot();
    illegalLegalRestPiePlot4.setSectionPaint("some data 1", new Color(0, 255, 0));
    illegalLegalRestPiePlot4.setSectionPaint("some data 2",
            new Color(255, 0, 0));
    PiePlot plot4 = (PiePlot) someChart.getPlot();
    plot4.setExplodePercent("some data 1", 0.4);
    plot4.setSimpleLabels(true);

    PieSectionLabelGenerator generator = new StandardPieSectionLabelGenerator(
            "{0} = {2}", new DecimalFormat("0"), new DecimalFormat("0.00%"));
    plot4.setLabelGenerator(generator);

    try {
        ChartUtilities.saveChartAsJPEG(new File("C:/myMinimalPieChartExample.jpeg"),
                someChart, 1200, 1000);
    } catch (Exception e) {
        System.err.println("couldn't write chart");
    }
    }
}
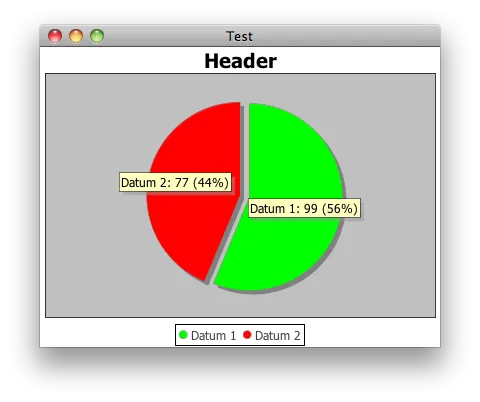
NumberFormat而不是DecimalFormat。代码示例如下:PieSectionLabelGenerator gen = new StandardPieSectionLabelGenerator("{0}: {1} ({2})", NumberFormat.getInstance(), NumberFormat.getPercentInstance()); plot.setLabelGenerator(gen);- gxet4n