使用 matplotlib 的 hist 函数,如何使其在柱形图上显示每个条形的计数?
例如:
import matplotlib.pyplot as plt
data = [ ... ] # some data
plt.hist(data, bins=10)
使用 matplotlib 的 hist 函数,如何使其在柱形图上显示每个条形的计数?
例如:
import matplotlib.pyplot as plt
data = [ ... ] # some data
plt.hist(data, bins=10)
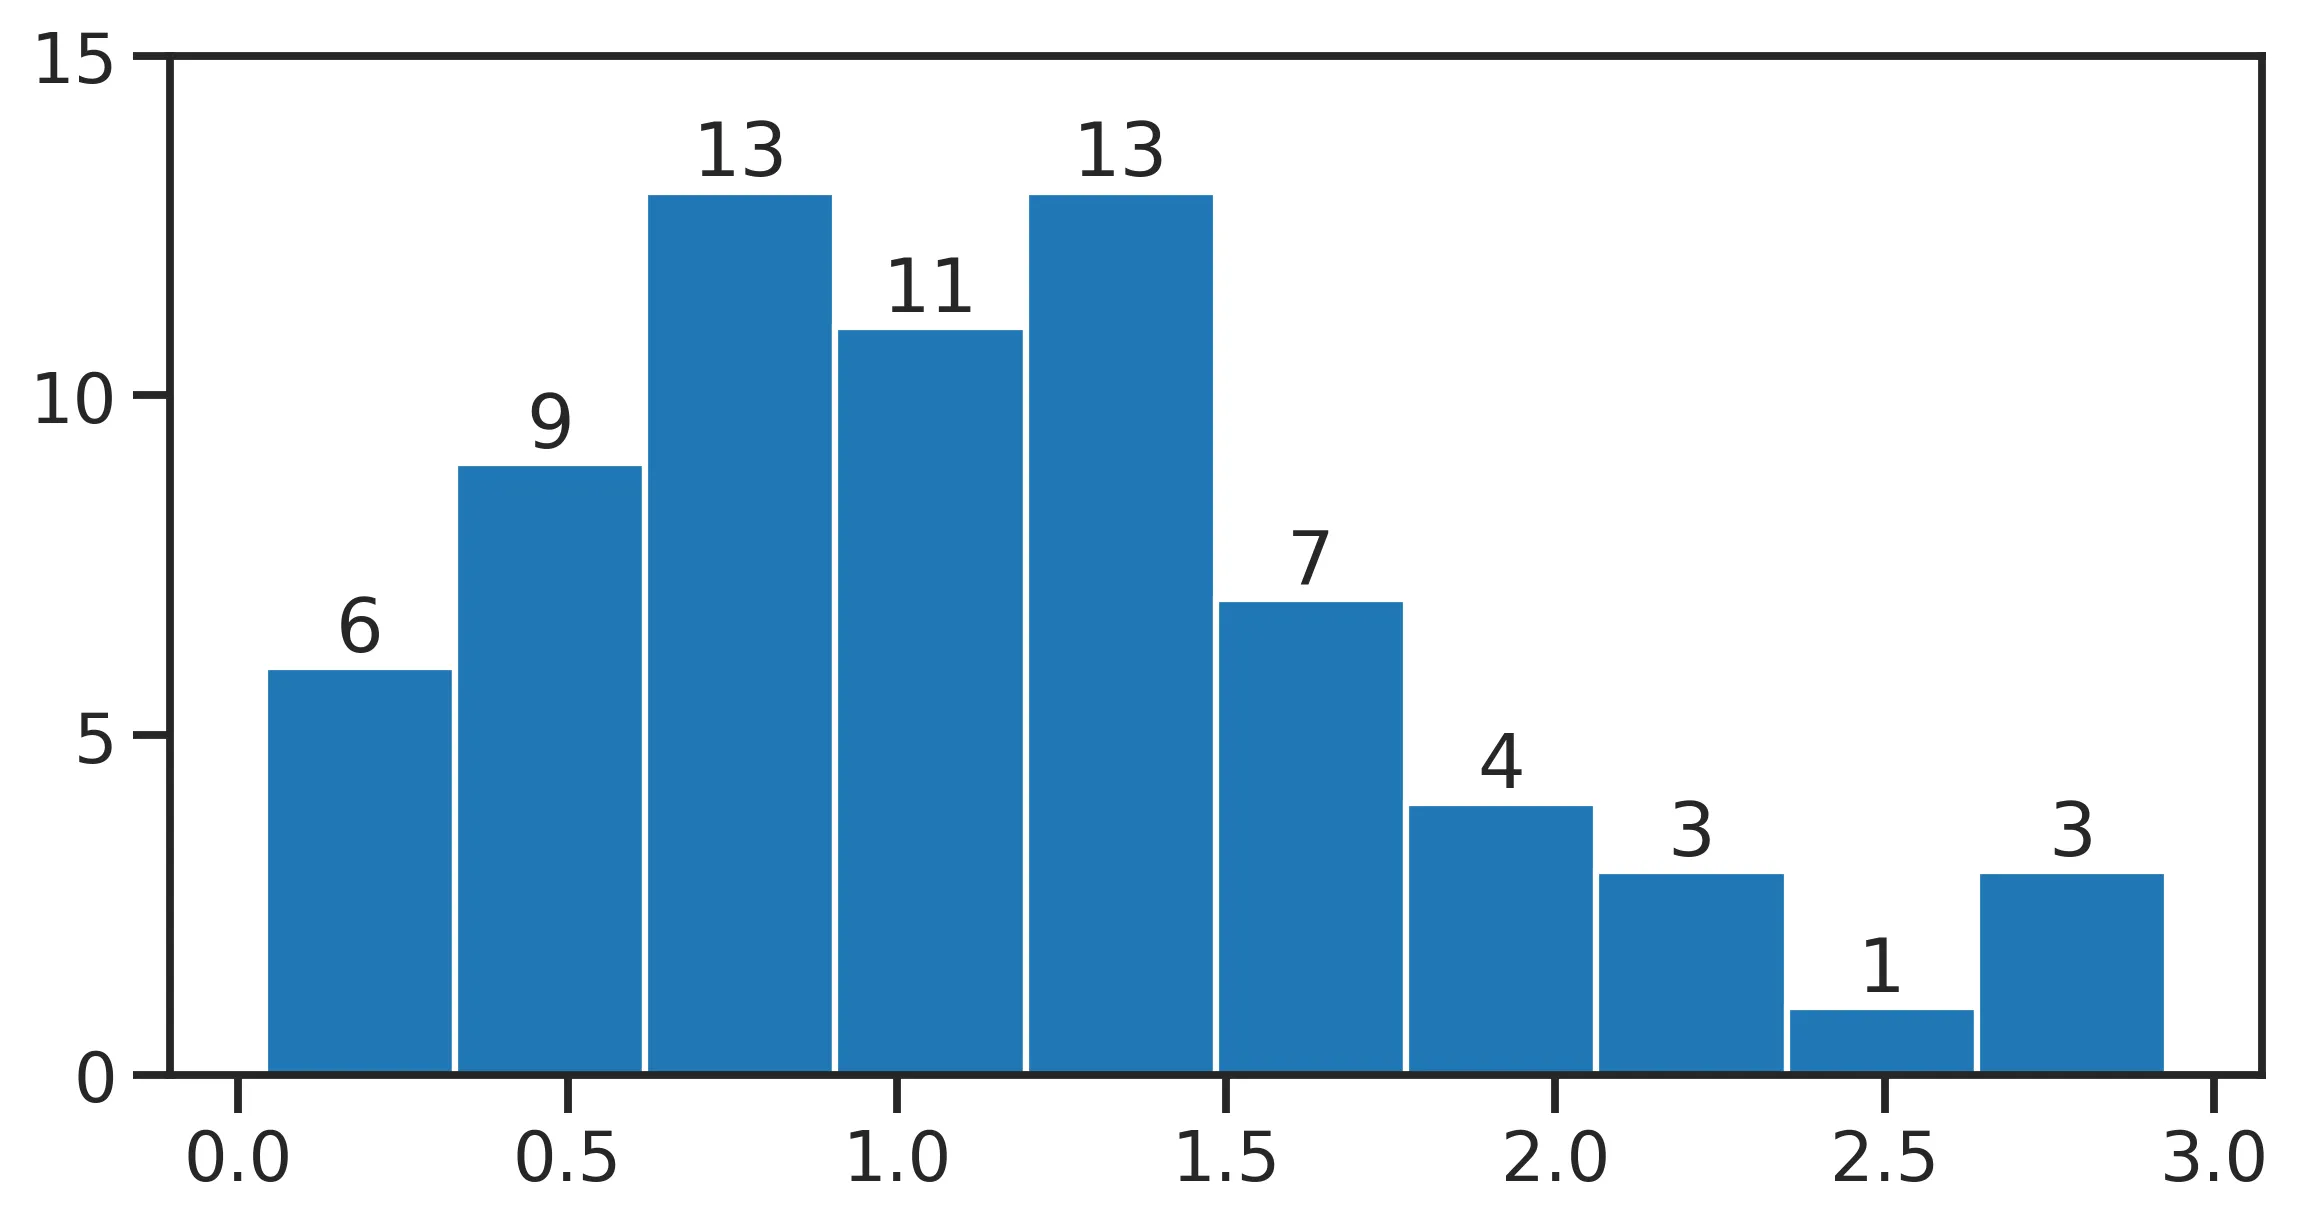
新增了一个plt.bar_label方法,可以自动标记条形容器。
plt.hist将条形图容器作为第三个输出返回:
data = np.random.default_rng(123).rayleigh(1, 70)
counts, edges, bars = plt.hist(data)
#              ^

plt.bar_label(bars)
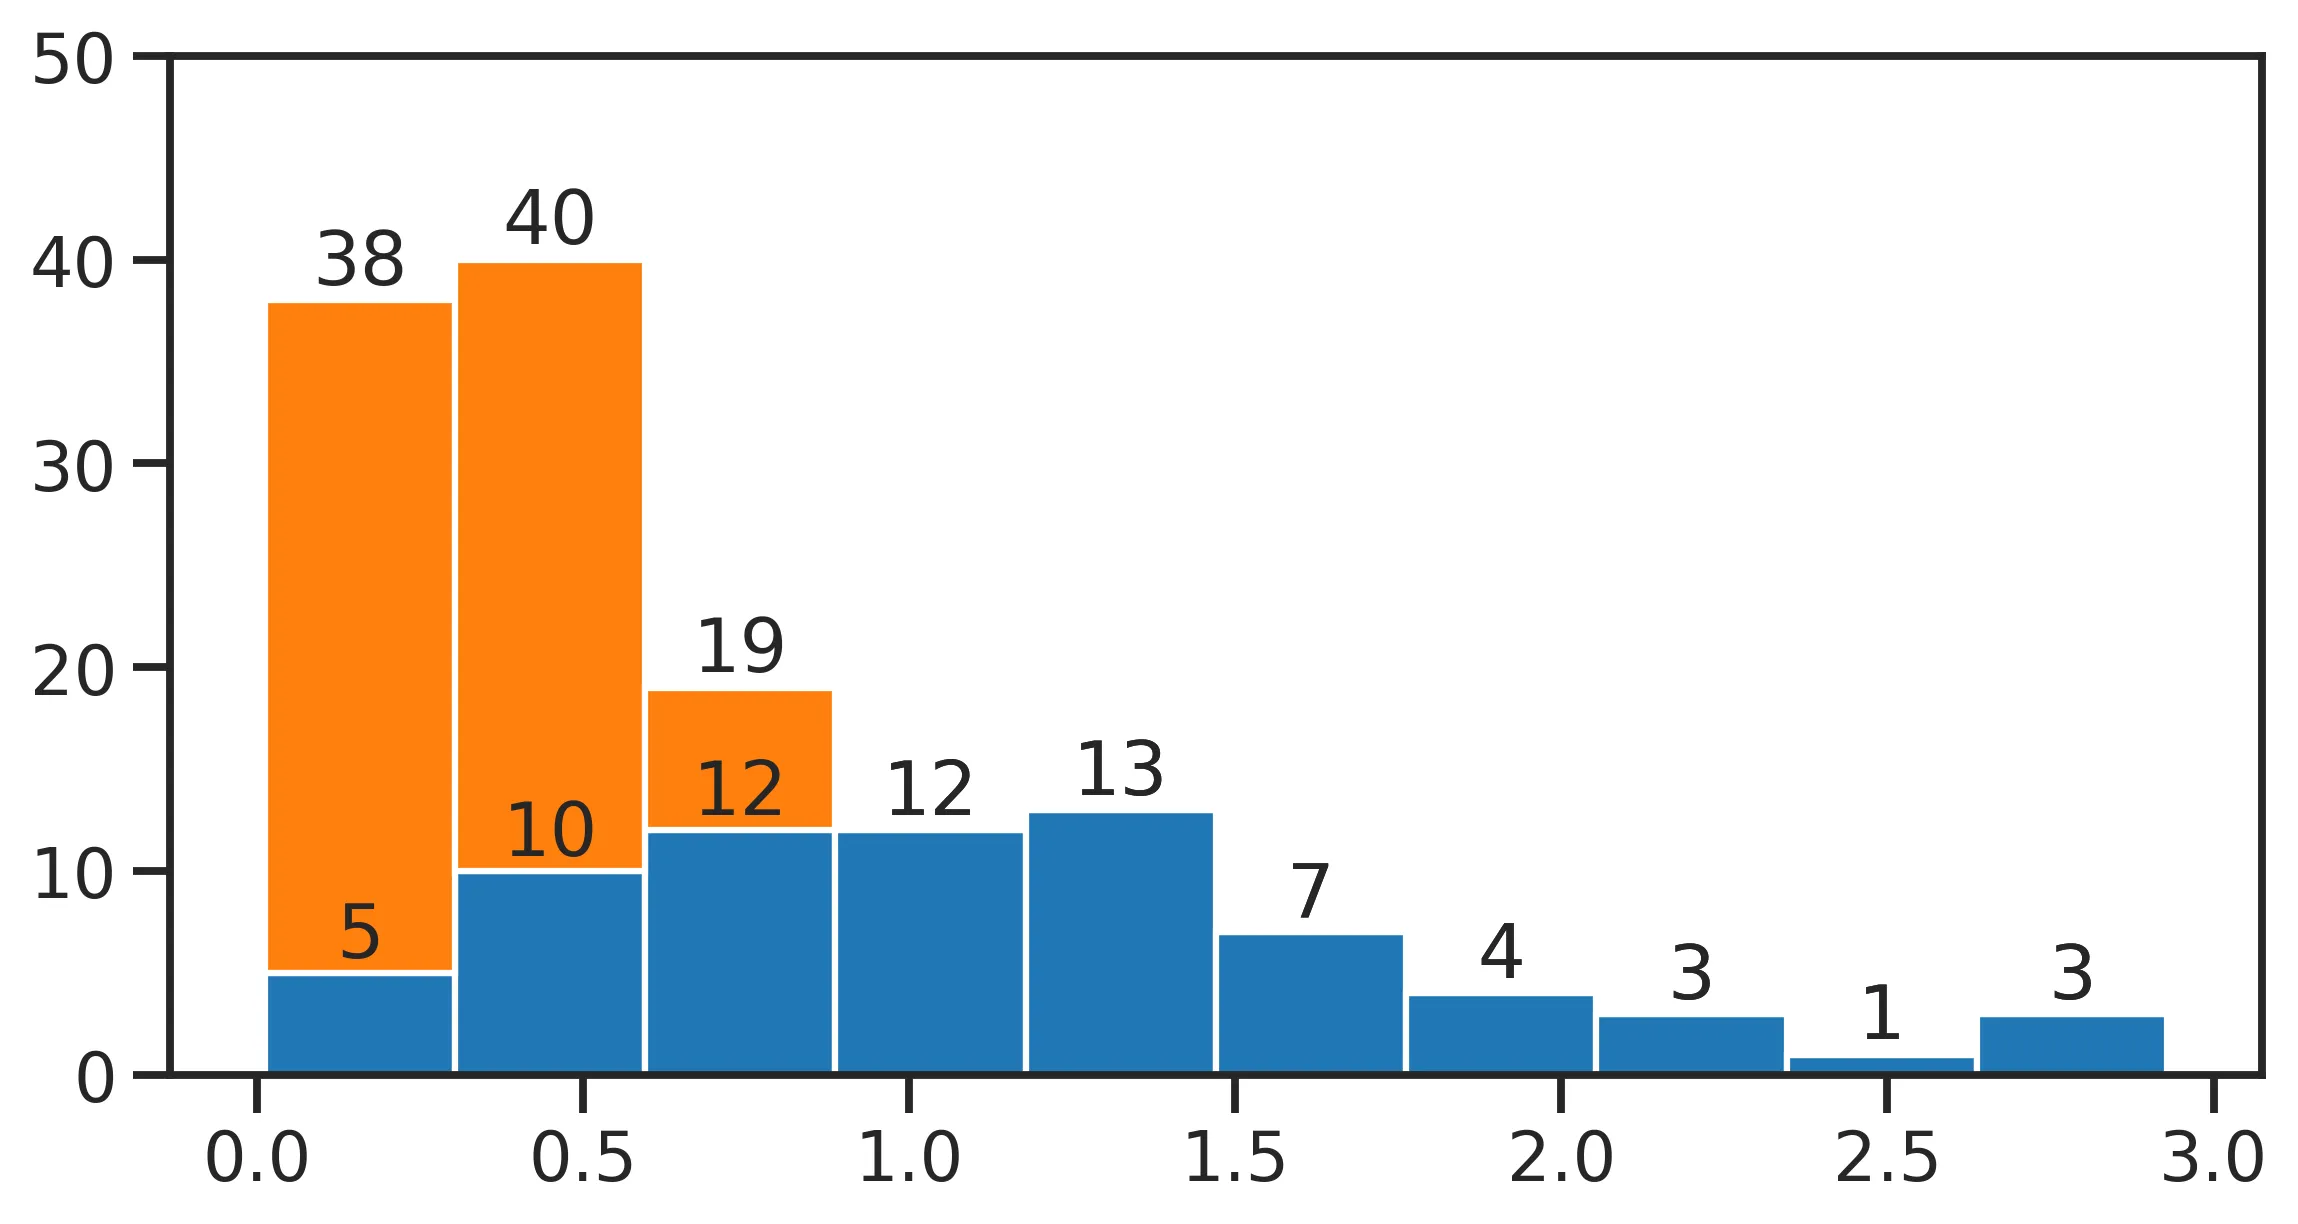
如果您有一个分组或堆叠的直方图,则 bars 将包含多个容器(每个组一个容器),因此请进行迭代:
fig, ax = plt.subplots()
counts, edges, bars = ax.hist([data, data * 0.3], histtype='barstacked')

for b in bars:
    ax.bar_label(b)
请注意,您还可以通过ax.containers访问柱形容器:
for c in ax.containers:
    ax.bar_label(c)
看起来 hist 不能完成这个任务,你可以自己编写一些代码来实现:
your_bins=20
data=[]
arr=plt.hist(data,bins=your_bins)
for i in range(your_bins):
    plt.text(arr[1][i],arr[0][i],str(arr[0][i]))
不仅使用plt.hist(),而是加入了一些额外的功能。
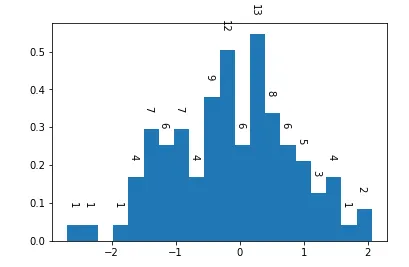
如果你不想事先指定你的箱子并且只绘制密度条,但也想显示箱子计数,那么可以使用以下方法。
import numpy as np
import matplotlib.pyplot as plt

data = np.random.randn(100)
density, bins, _ = plt.hist(data, density=True, bins=20)
count, _ = np.histogram(data, bins)
for x,y,num in zip(bins, density, count):
    if num != 0:
        plt.text(x, y+0.05, num, fontsize=10, rotation=-90) # x,y,str
结果如下所示:
labels参数传递经过筛选的datavalues列表(类似于此回答),例如:plt.bar_label(bars, labels=[v if v > 0 else '' for v in bars.datavalues])。 - tdydata,另一个是data*0.3。 - tdy