用箭头标记matplotlib直方图的柱形区间

9

我有一张直方图,可以使用下面的MWE进行复制:

import pandas as pd
import matplotlib.pyplot as plt
import seaborn as sns
import numpy as np

pd.Series(np.random.normal(0, 100, 1000)).plot(kind='hist', bins=50)

这将创建如下图所示的绘图:

example histogram

那么,我应该如何为给定的整数添加箭头标签?

例如,如下图所示,箭头标记包含整数300的箱子。

example with bin of integer labelled

编辑:最好可以通过其标记的条形图高度自动设置箭头的y坐标!

2个回答

7
您可以使用annotate来添加箭头:
import pandas as pd
import matplotlib.pyplot as plt
#import seaborn as sns
import numpy as np

fig, ax = plt.subplots()
series = pd.Series(np.random.normal(0, 100, 1000))
series.plot(kind='hist', bins=50, ax=ax)
ax.annotate("",
            xy=(300, 5), xycoords='data',
            xytext=(300, 20), textcoords='data',
            arrowprops=dict(arrowstyle="->",
                            connectionstyle="arc3"),
            )

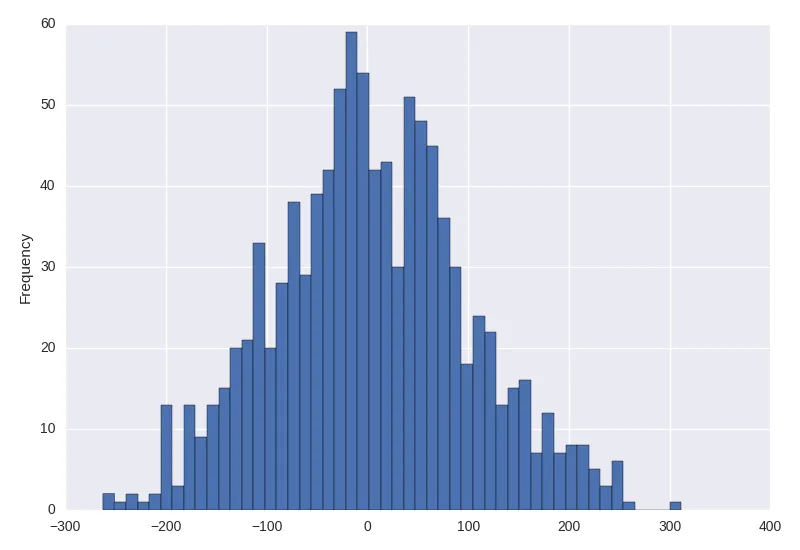
在这个例子中,我添加了一个箭头,从坐标(300, 20)到(300, 5)。
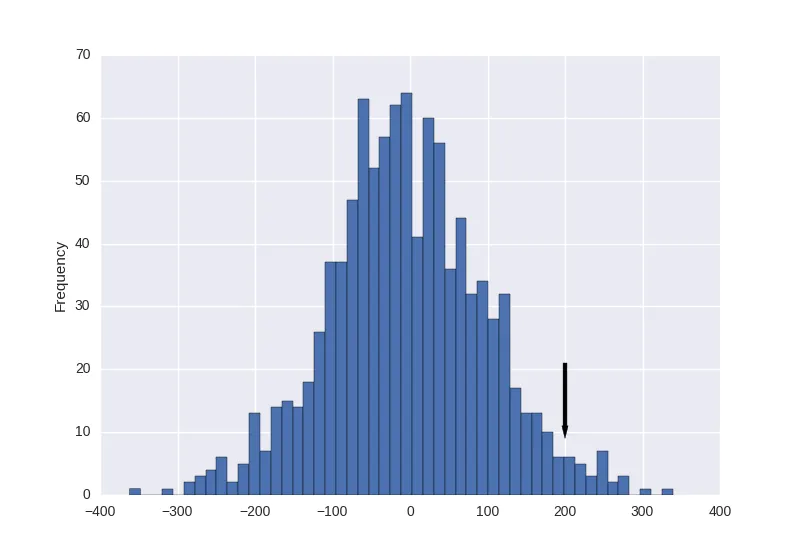
为了将箭头自动缩放到bin中的值,您可以使用matplotlib的hist绘制直方图并获取返回的值,然后使用numpy的where找到对应所需位置的bin。
import pandas as pd
import matplotlib.pyplot as plt
#import seaborn as sns
import numpy as np

nbins = 50
labeled_bin = 200

fig, ax = plt.subplots()

series = pd.Series(np.random.normal(0, 100, 1000))

## plot the histogram and return the bin position and values
ybins, xbins, _ = ax.hist(series, bins=nbins)

## find out in which bin belongs the position where you want the label
ind_bin = np.where(xbins >= labeled_bin)[0]
if len(ind_bin) > 0 and ind_bin[0] > 0:
    ## get position and value of the bin
    x_bin = xbins[ind_bin[0]-1]/2. + xbins[ind_bin[0]]/2.
    y_bin = ybins[ind_bin[0]-1]
    ## add the arrow
    ax.annotate("",
                xy=(x_bin, y_bin + 5), xycoords='data',
                xytext=(x_bin, y_bin + 20), textcoords='data',
                arrowprops=dict(arrowstyle="->",
                                connectionstyle="arc3"),
                                )
else:
    print "Labeled bin is outside range"

谢谢回复,进一步扩展这个问题,是否有可能根据箱子的高度自动设置箭头的y位置? - BML91
@BML91 是的,这是可能的...让我编辑我的答案。 - Julien Spronck
太好了,谢谢你。我正在查看文档以改变箭头线的重量,但似乎找不到任何相关信息 - 你可以帮助指一下吗? - BML91
我看到了 arrowprops() 中的 width 关键字,但是当我尝试使用它时,出现了 AttributeError: Unknown property width 的错误。 - BML91
1
@BML91:在我的下面的解决方案中,“width”运行良好(我更新了我的代码)。对于这个答案,你必须在“arrowprops()”内使用“lw”而不是“width”;然后它就可以正常工作了。 - Cleb

2

@Julien Spronck展示了最好的方法,我认为。另外,您还可以使用arrow;下面可以找到示例代码。Y坐标是通过计算某个箱子中有多少元素(您可以自定义某个容差)来自动确定的。您可以调整参数(箭头头部长度、箭头长度)。以下是代码:

import pandas as pd
import matplotlib.pyplot as plt
import seaborn as sns
import numpy as np

mySer = pd.Series(np.random.normal(0, 100, 1000))
mySer.plot(kind='hist', bins=50)

# that is where you want to add the arrow
ind = 200
# determine how many elements you have in the bin (with a certain tolerance)
n = len(mySer[(mySer > ind*0.95) & (mySer <  ind*1.05)])

# define length of the arrow
lenArrow = 10
lenHead = 2
wiArrow = 5
plt.arrow(ind, n+lenArrow+lenHead, 0, -lenArrow, head_width=wiArrow+3, head_length=lenHead, width=wiArrow, fc='k', ec='k')

plt.show()

这将给你以下输出结果(与你示例中的300相比为200):

enter image description here


网页内容由stack overflow 提供, 点击上面的
可以查看英文原文,
原文链接