我正在寻找一种绘制分布直方图的方法,其中
以下是图表示例:
左边的图表中,有55个代理商售出了20-30套房子
右边的图表中,售出20-30套房子的代理商代表了售出的1100套房子
y轴表示每个区间的总物品数量(而不仅仅是计数)。以下是图表示例:
左边的图表中,有55个代理商售出了20-30套房子
右边的图表中,售出20-30套房子的代理商代表了售出的1100套房子
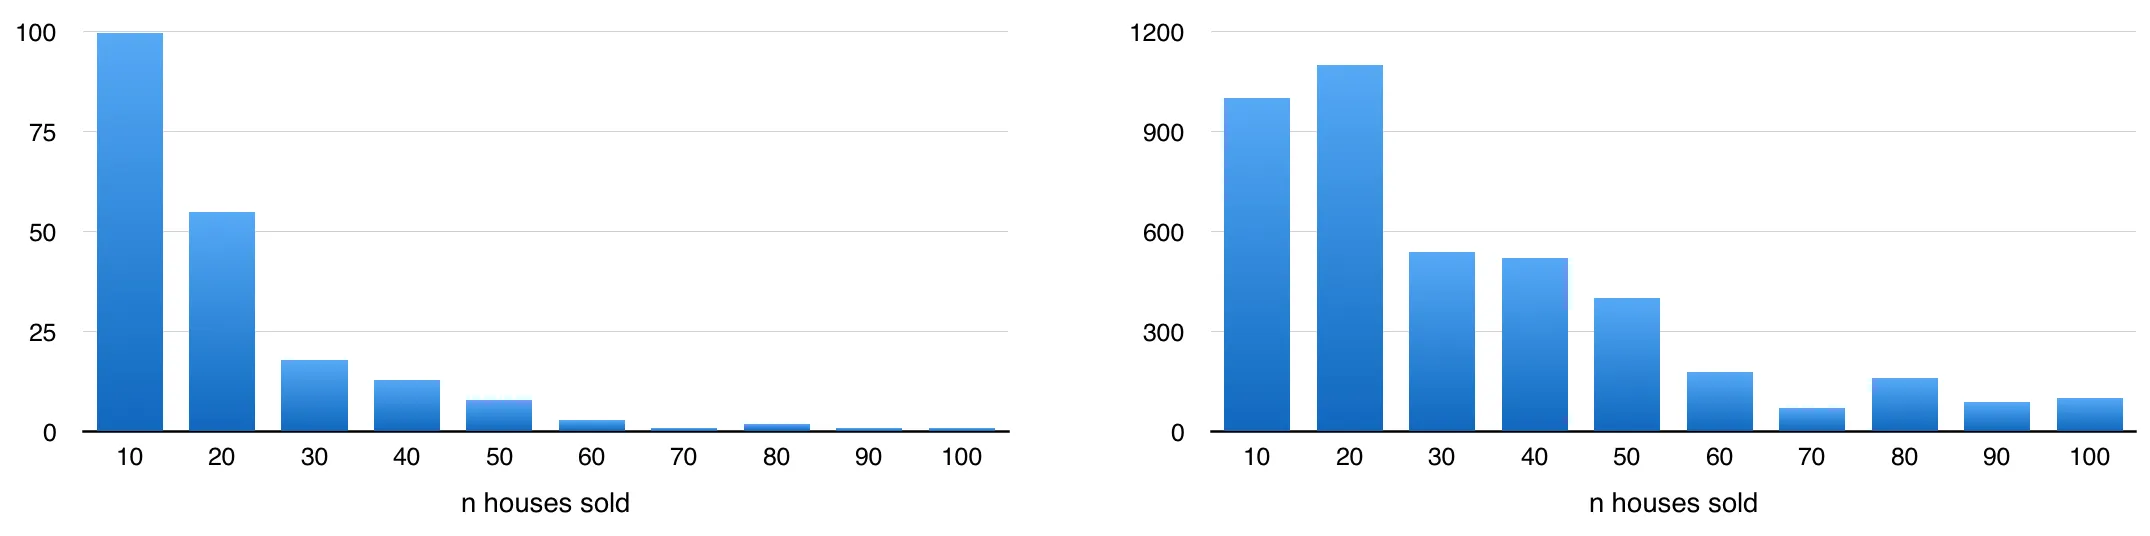
这并不像看起来那么简单,因为不能简单地将每个箱的计数乘以箱的值(也许在20-30箱中,有54个机构销售了21个,有1个机构销售了29个)。
问题:
- 这种图表的名称是什么(右侧的图表)?
- 是否有一种方法可以在
matplotlib或seaborn中本地绘制它?