我正在尝试绘制直方图,但在“图形窗口”中没有显示任何内容。 我的代码如下:
import numpy as np
import matplotlib.pyplot as plt
values = [1000000, 1525097, 2050194, 1095638, 1620736, 2145833, 1191277, 1716375, 1286916, 1382555]
plt.hist(values, 10, histtype = 'bar', facecolor = 'blue')
plt.ylabel("Values")
plt.xlabel("Bin Number")
plt.title("Histogram")
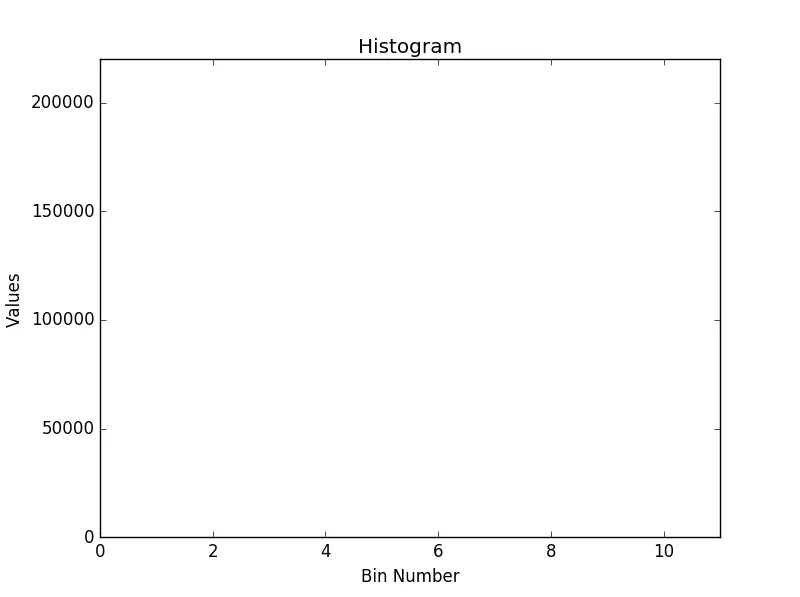
plt.axis([0,11,0,220000])
plt.show()
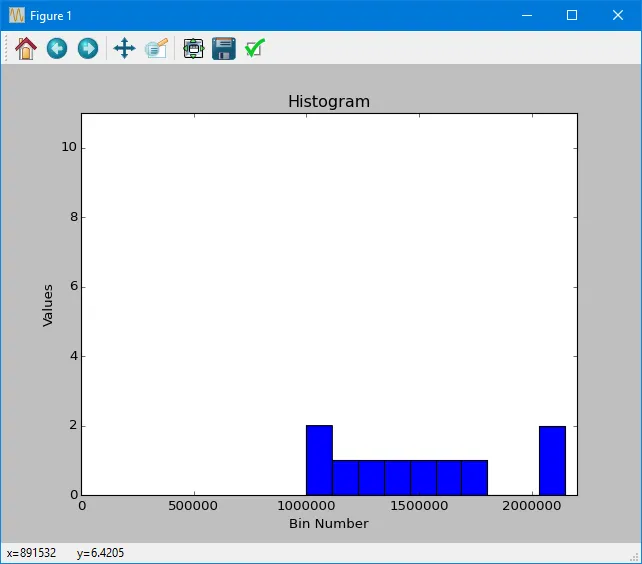
这是输出结果:
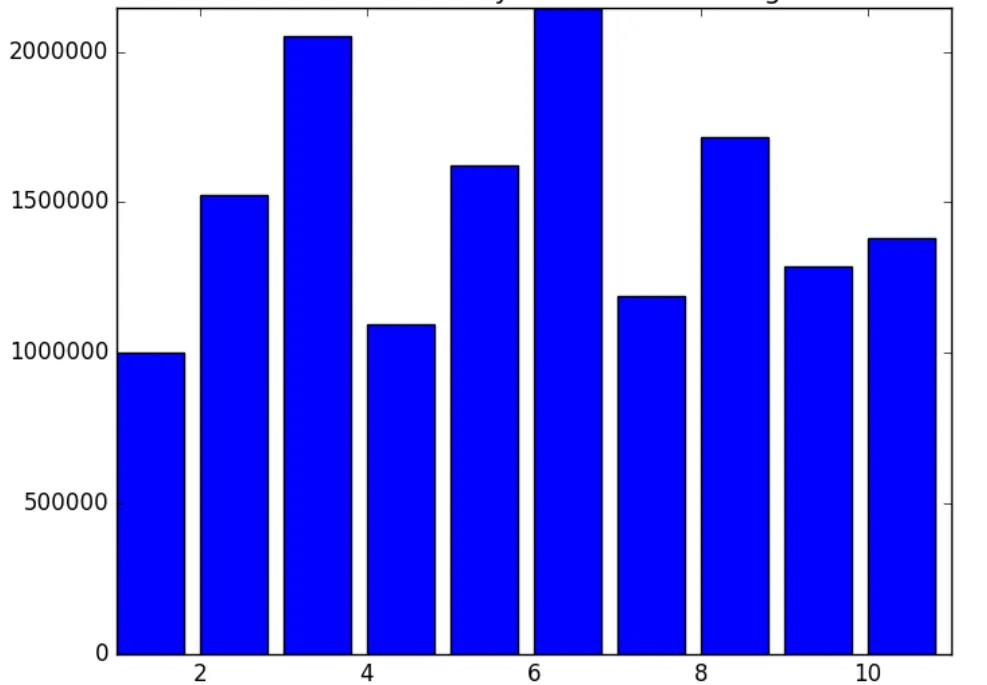
 我尝试实现这个图表:
 如有帮助,将不胜感激...