简短回答:使用plt.hist(data, bins=range(50))以获得左对齐的箱子,plt.hist(data, bins=np.arange(50)-0.5)以获得中心对齐的箱子等。
另外,如果性能很重要,因为您想要唯一整数的计数,有几种略微更有效的方法(np.bincount),我将在最后展示。
问题陈述
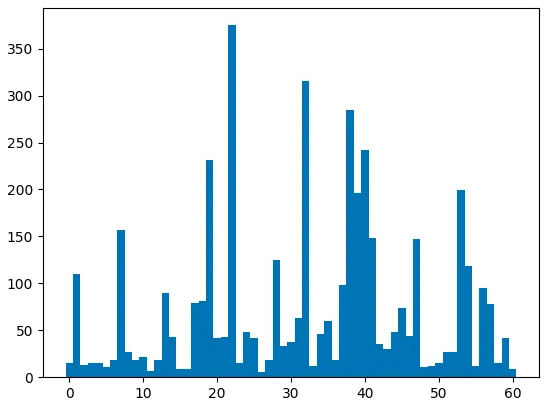
作为您所看到的内容的独立示例,请考虑以下内容:
import matplotlib.pyplot as plt
import numpy as np
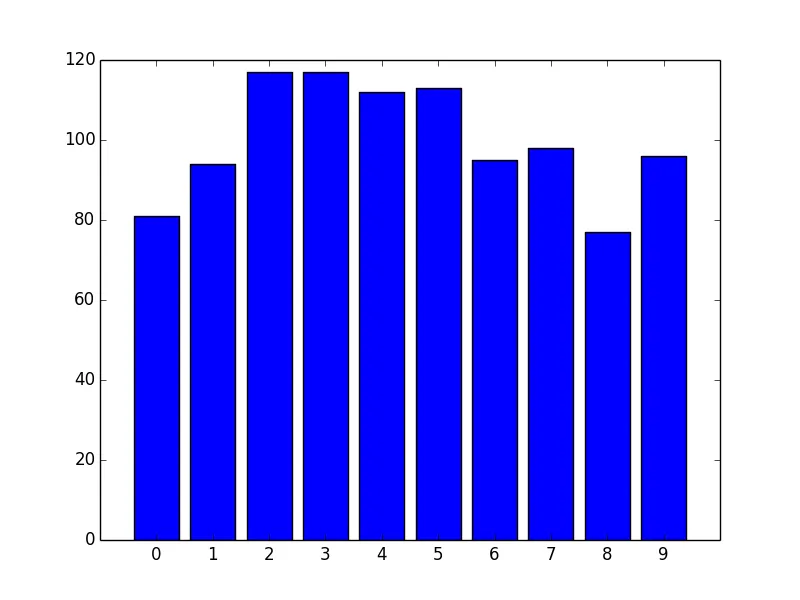
data = np.random.randint(0, 10, 1000)
plt.hist(data, bins=10)
plt.xticks(range(10))
plt.show()
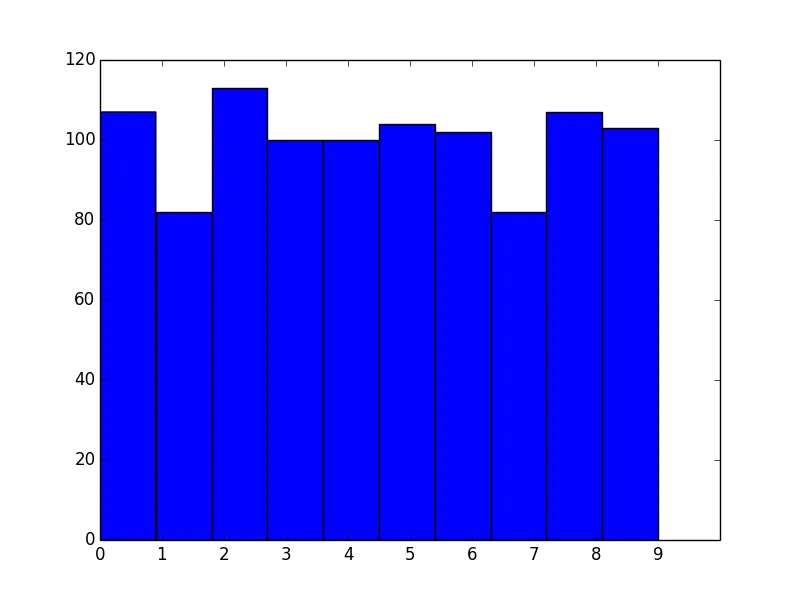
正如您所注意到的,这些箱子与整数区间不对齐。这基本上是因为您要求在0和9之间有10个垃圾箱,这并不完全等同于为10个唯一值请求垃圾箱。
您想要的垃圾箱的数量与唯一值的数量并不完全相同。在这种情况下,您实际上应该手动指定bin边缘。
为了解释发生了什么,请跳过matplotlib.pyplot.hist,直接使用底层的numpy.histogram函数。
例如,假设您有值[0、1、2、3]。您的第一反应可能是执行:
In [1]: import numpy as np

In [2]: np.histogram([0, 1, 2, 3], bins=4)
Out[2]: (array([1, 1, 1, 1]), array([ 0.  ,  0.75,  1.5 ,  2.25,  3.  ]))
返回的第一个数组是计数,第二个数组是箱边缘(换句话说,它们是您绘图中条形图边缘的位置)。
请注意,我们得到了预期的计数,但是因为我们要求在数据的最小值和最大值之间有4个bin,所以bin的边缘不在整数值上。
接下来,您可以尝试:
In [3]: np.histogram([0, 1, 2, 3], bins=3)
Out[3]: (array([1, 1, 2]), array([ 0.,  1.,  2.,  3.]))
请注意,bin边缘(即第二个数组)是您预期的,但计数不正确。这是因为最后一个bin的行为与其他bin不同,正如numpy.histogram文档中所述:
Notes
-----
All but the last (righthand-most) bin is half-open.  In other words, if
`bins` is::

  [1, 2, 3, 4]

then the first bin is ``[1, 2)`` (including 1, but excluding 2) and the
second ``[2, 3)``.  The last bin, however, is ``[3, 4]``, which *includes*
4.
因此,你实际上应该明确指定你想要的分箱边界,并将其设置为 0.5 的间隔,然后要么在最后一个数据点之外包含一个 bin 边缘,要么将 bin 边缘进行移动。例如:
In [4]: np.histogram([0, 1, 2, 3], bins=range(5))
Out[4]: (array([1, 1, 1, 1]), array([0, 1, 2, 3, 4]))
二进制对齐
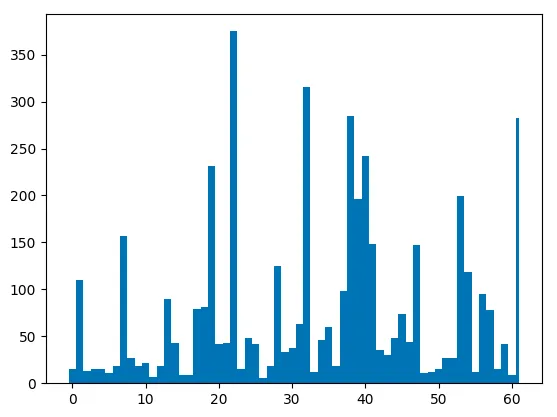
现在让我们将其应用于第一个示例,看看它是什么样子:
import matplotlib.pyplot as plt
import numpy as np
data = np.random.randint(0, 10, 1000)
plt.hist(data, bins=range(11))
plt.xticks(range(10))
plt.show()
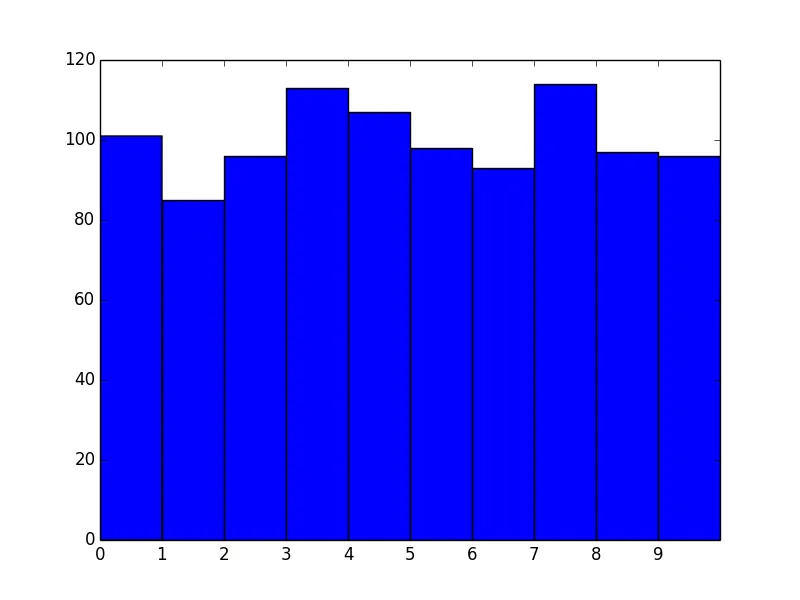
好的,很好!然而,我们现在实际上有了左对齐的容器。如果我们想要中心对齐的容器更好地反映这些是唯一值,该怎么办?
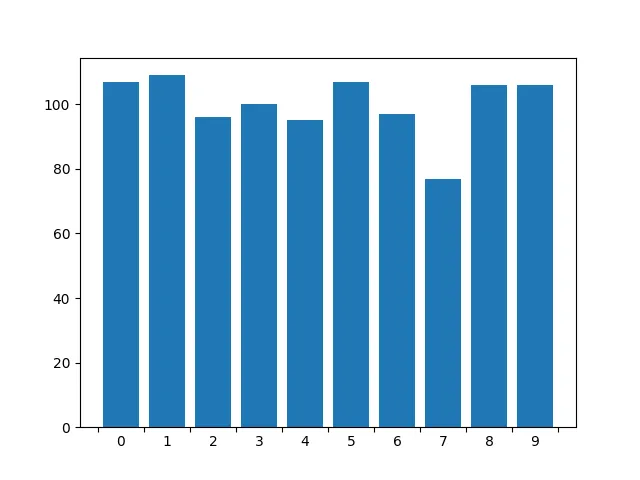
快速的方法就是移动容器边缘:
import matplotlib.pyplot as plt
import numpy as np
data = np.random.randint(0, 10, 1000)
bins = np.arange(11) - 0.5
plt.hist(data, bins)
plt.xticks(range(10))
plt.xlim([-1, 10])
plt.show()
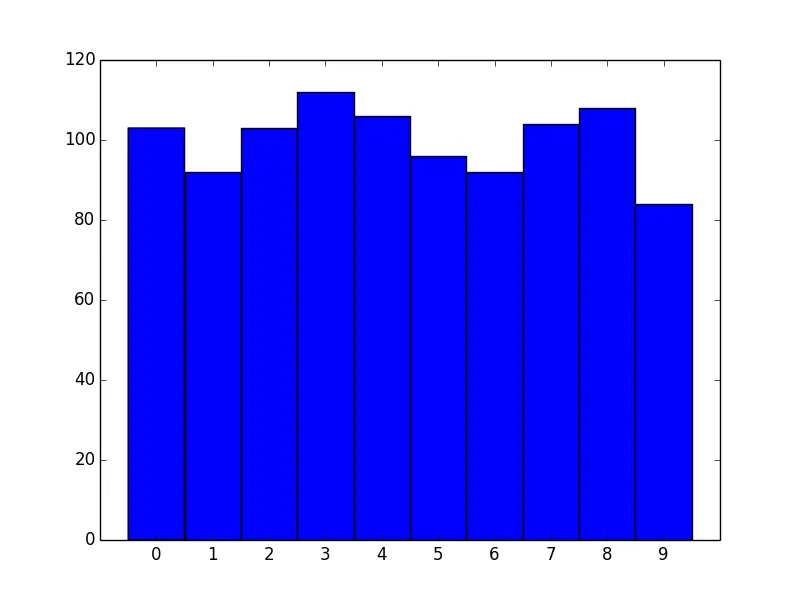
同样地,对于右对齐的容器,只需将其偏移-1。
另一种方法
对于唯一整数值的特殊情况,我们可以采用另一种更有效的方法。
如果您处理的是从0开始的唯一整数计数,则最好使用numpy.bincount而不是使用numpy.hist。
例如:
import matplotlib.pyplot as plt
import numpy as np
data = np.random.randint(0, 10, 1000)
counts = np.bincount(data)
fig, ax = plt.subplots()
ax.bar(range(10), counts, width=1, align='center')
ax.set(xticks=range(10), xlim=[-1, 10])
plt.show()
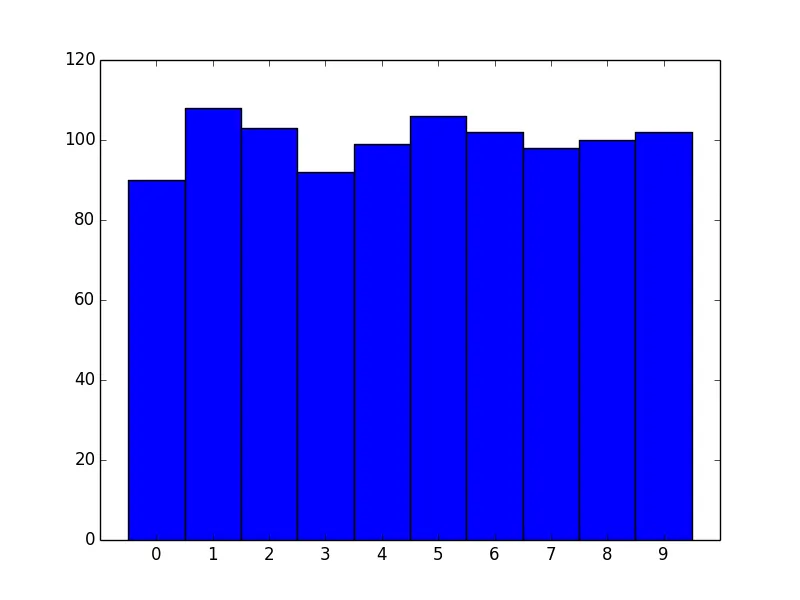
这种方法有两个主要优点。一个是速度。 numpy.histogram(因此plt.hist)基本上通过numpy.digitize和numpy.bincount运行数据。由于您正在处理唯一的整数值,因此不需要执行numpy.digitize步骤。
然而,更大的优势是在显示方面具有更多控制权。如果您希望矩形更细,请使用较小的宽度:
import matplotlib.pyplot as plt
import numpy as np
data = np.random.randint(0, 10, 1000)
counts = np.bincount(data)
fig, ax = plt.subplots()
ax.bar(range(10), counts, width=0.8, align='center')
ax.set(xticks=range(10), xlim=[-1, 10])
plt.show()
histogram_data绘制成直方图时,会得到一个具有49个均匀间隔数字的图形。当您说“我想显示每个值的直方图”时,您的意思是什么? - Srivatsan