我正在尝试使用matplotlib绘制一个简单的直方图。例如,我有以下数据(实际上我会使用不同的距离函数):
import matplotlib.pyplot as plt
import numpy as np
import itertools


def hamdist(str1, str2):
    """Count the # of differences between equal length strings str1 and str2"""
    if (len(str1) != len(str2)):
        print str1, str2, "Length mismatch bozo!!!!!!"
    diffs = 0
    for ch1, ch2 in itertools.izip(str1, str2):
        if ch1 != ch2:
            diffs += 1
    return diffs

n = 10
bins=np.arange(0,n+2,1)
hamdists = []
for str1 in itertools.product('01', repeat = n):
    for str2 in itertools.product('01', repeat = n):
        hamdists.append(hamdist(str1, str2))
plt.hist(hamdists, bins=bins)
plt.show()
我得到了如下所示的直方图。
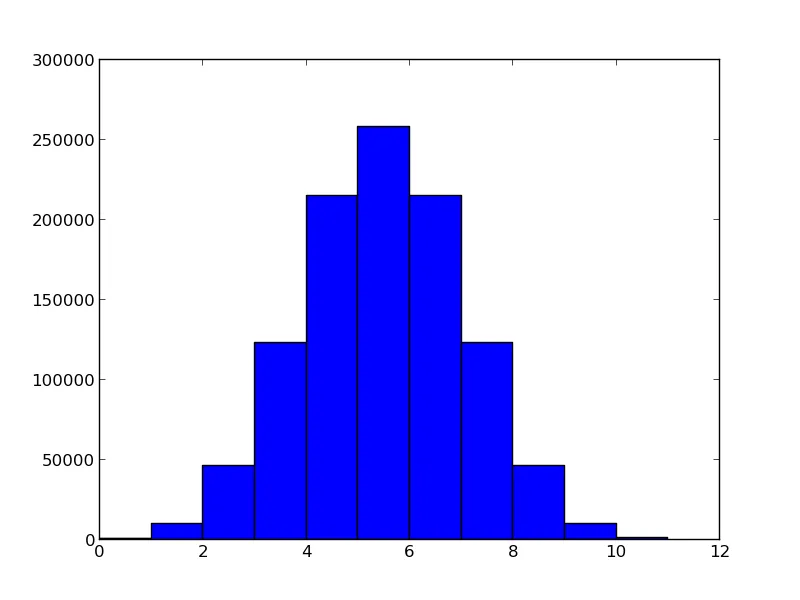
- 如何实现以下更改?
- 将x轴更改为最后一个柱子计算x = 10的数量。如果我只是简单地更改为
bins=np.arange(0,11,1),那么这就削减了x = 10的值。 - 为x轴上的每个点进行标注。
- 将x轴标签移动到条形的中间而不是现在的开头。
hist、bins、bars = ax.hist()。 - Rutger Kassies