有没有办法在matplotlib / pyplot中制作分层直方图?
我已经知道如何使用 alpha 标签实现透明度,但我找不到一种叠加的方法
例如,如果有两组具有共同y轴绘图的数据集,则应首先绘制最小频率,以便可以将其显示在较大频率的顶部。
透明度无法正常工作,因为它会改变颜色,从而使其与键不匹配。
有没有办法在matplotlib / pyplot中制作分层直方图?
我已经知道如何使用 alpha 标签实现透明度,但我找不到一种叠加的方法
例如,如果有两组具有共同y轴绘图的数据集,则应首先绘制最小频率,以便可以将其显示在较大频率的顶部。
透明度无法正常工作,因为它会改变颜色,从而使其与键不匹配。
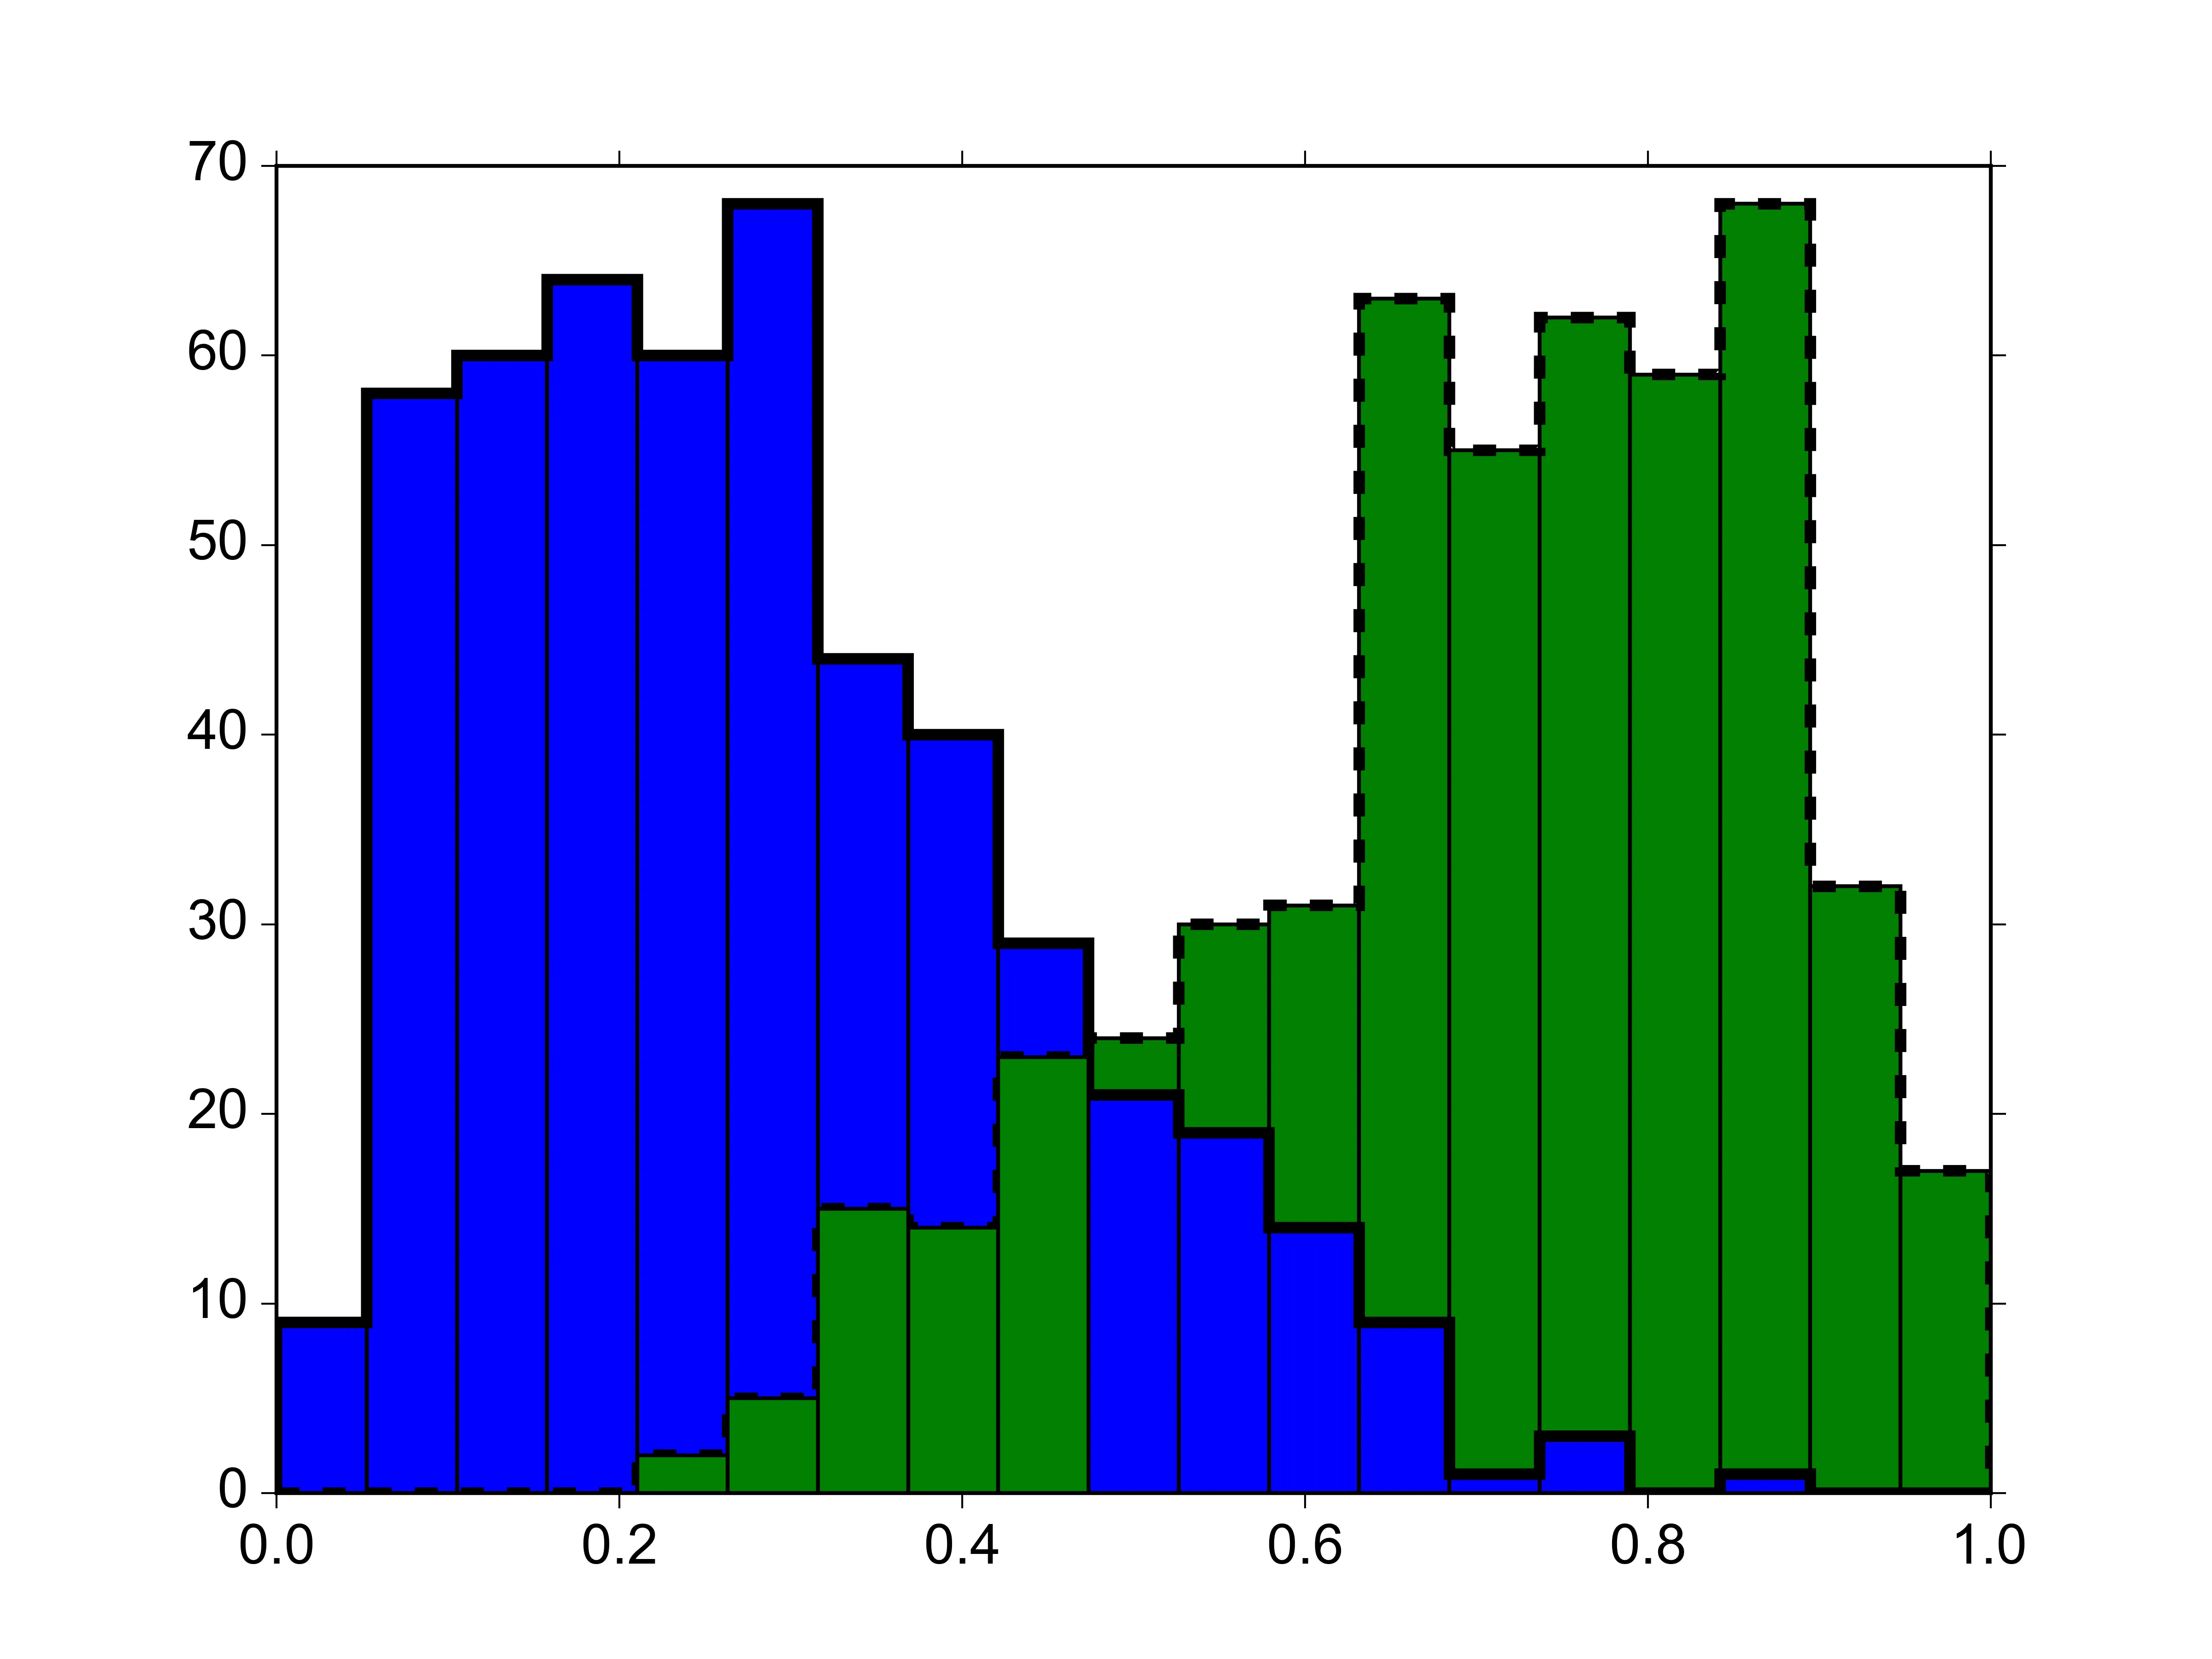
我认为您可以通过根据每个条形图的高度设置其z-order来获得所需的效果:
import numpy as np
from matplotlib import pyplot as plt

# two overlapping distributions
x1 = np.random.beta(2, 5, 500)
x2 = np.random.beta(5, 2, 500)

fig, ax = plt.subplots(1, 1)
ax.hold(True)

# plot the histograms as usual
bins = np.linspace(0, 1, 20)
counts1, edges1, bars1 = ax.hist(x1, bins)
counts2, edges2, bars2 = ax.hist(x2, bins)

# plot the histograms as lines as well for clarity
ax.hist(x1, bins, histtype='step', ec='k', ls='solid', lw=3)
ax.hist(x2, bins, histtype='step', ec='k', ls='dashed', lw=3)

# set the z-order of each bar according to its relative height
x2_bigger = counts2 > counts1
for b1, b2, oo in zip(bars1, bars2, x2_bigger):
    if oo:
        # if bar 2 is taller than bar 1, place it behind bar 1
        b2.set_zorder(b1.get_zorder() - 1)
    else:
        # otherwise place it in front
        b2.set_zorder(b1.get_zorder() + 1)

plt.show()