首先,我要说的是,当涉及到复杂的3D图形时,matplotlib可能不是最佳选择。
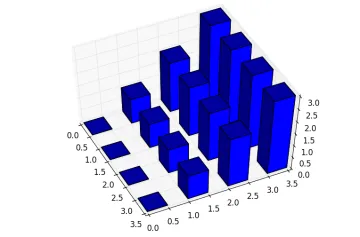
话虽如此,在条形图上没有内置方法可以产生不同颜色的条形。
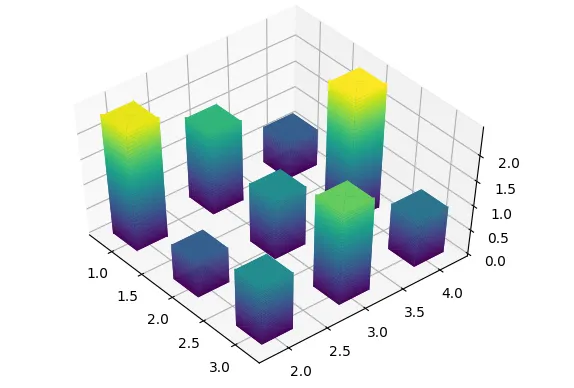
因此,我们需要以某种方式模拟条形。下面是一种可能的解决方案。在这里,我们使用
plot_surface绘制一个包含渐变的条形图。
from mpl_toolkits.mplot3d import Axes3D
import matplotlib.pyplot as plt
import matplotlib.colors
import numpy as np
fig = plt.figure()
ax = fig.add_subplot(111, projection= Axes3D.name)
def make_bar(ax, x0=0, y0=0, width = 0.5, height=1 , cmap="viridis",
norm=matplotlib.colors.Normalize(vmin=0, vmax=1), **kwargs ):
u = np.linspace(0, 2*np.pi, 4+1)+np.pi/4.
v_ = np.linspace(np.pi/4., 3./4*np.pi, 100)
v = np.linspace(0, np.pi, len(v_)+2 )
v[0] = 0 ; v[-1] = np.pi; v[1:-1] = v_
x = np.outer(np.cos(u), np.sin(v))
y = np.outer(np.sin(u), np.sin(v))
z = np.outer(np.ones(np.size(u)), np.cos(v))
xthr = np.sin(np.pi/4.)**2 ; zthr = np.sin(np.pi/4.)
x[x > xthr] = xthr; x[x < -xthr] = -xthr
y[y > xthr] = xthr; y[y < -xthr] = -xthr
z[z > zthr] = zthr ; z[z < -zthr] = -zthr
x *= 1./xthr*width; y *= 1./xthr*width
z += zthr
z *= height/(2.*zthr)
x += x0; y += y0
ax.plot_surface(x, y, z, cmap=cmap, norm=norm, **kwargs)
def make_bars(ax, x, y, height, width=1):
widths = np.array(width)*np.ones_like(x)
x = np.array(x).flatten()
y = np.array(y).flatten()
h = np.array(height).flatten()
w = np.array(widths).flatten()
norm = matplotlib.colors.Normalize(vmin=0, vmax=h.max())
for i in range(len(x.flatten())):
make_bar(ax, x0=x[i], y0=y[i], width = w[i] , height=h[i], norm=norm)
X, Y = np.meshgrid([1,2,3], [2,3,4])
Z = np.sin(X*Y)+1.5
make_bars(ax, X,Y,Z, width=0.2, )
plt.show()