如何在Matplotlib中绘制填充的弧形。

9
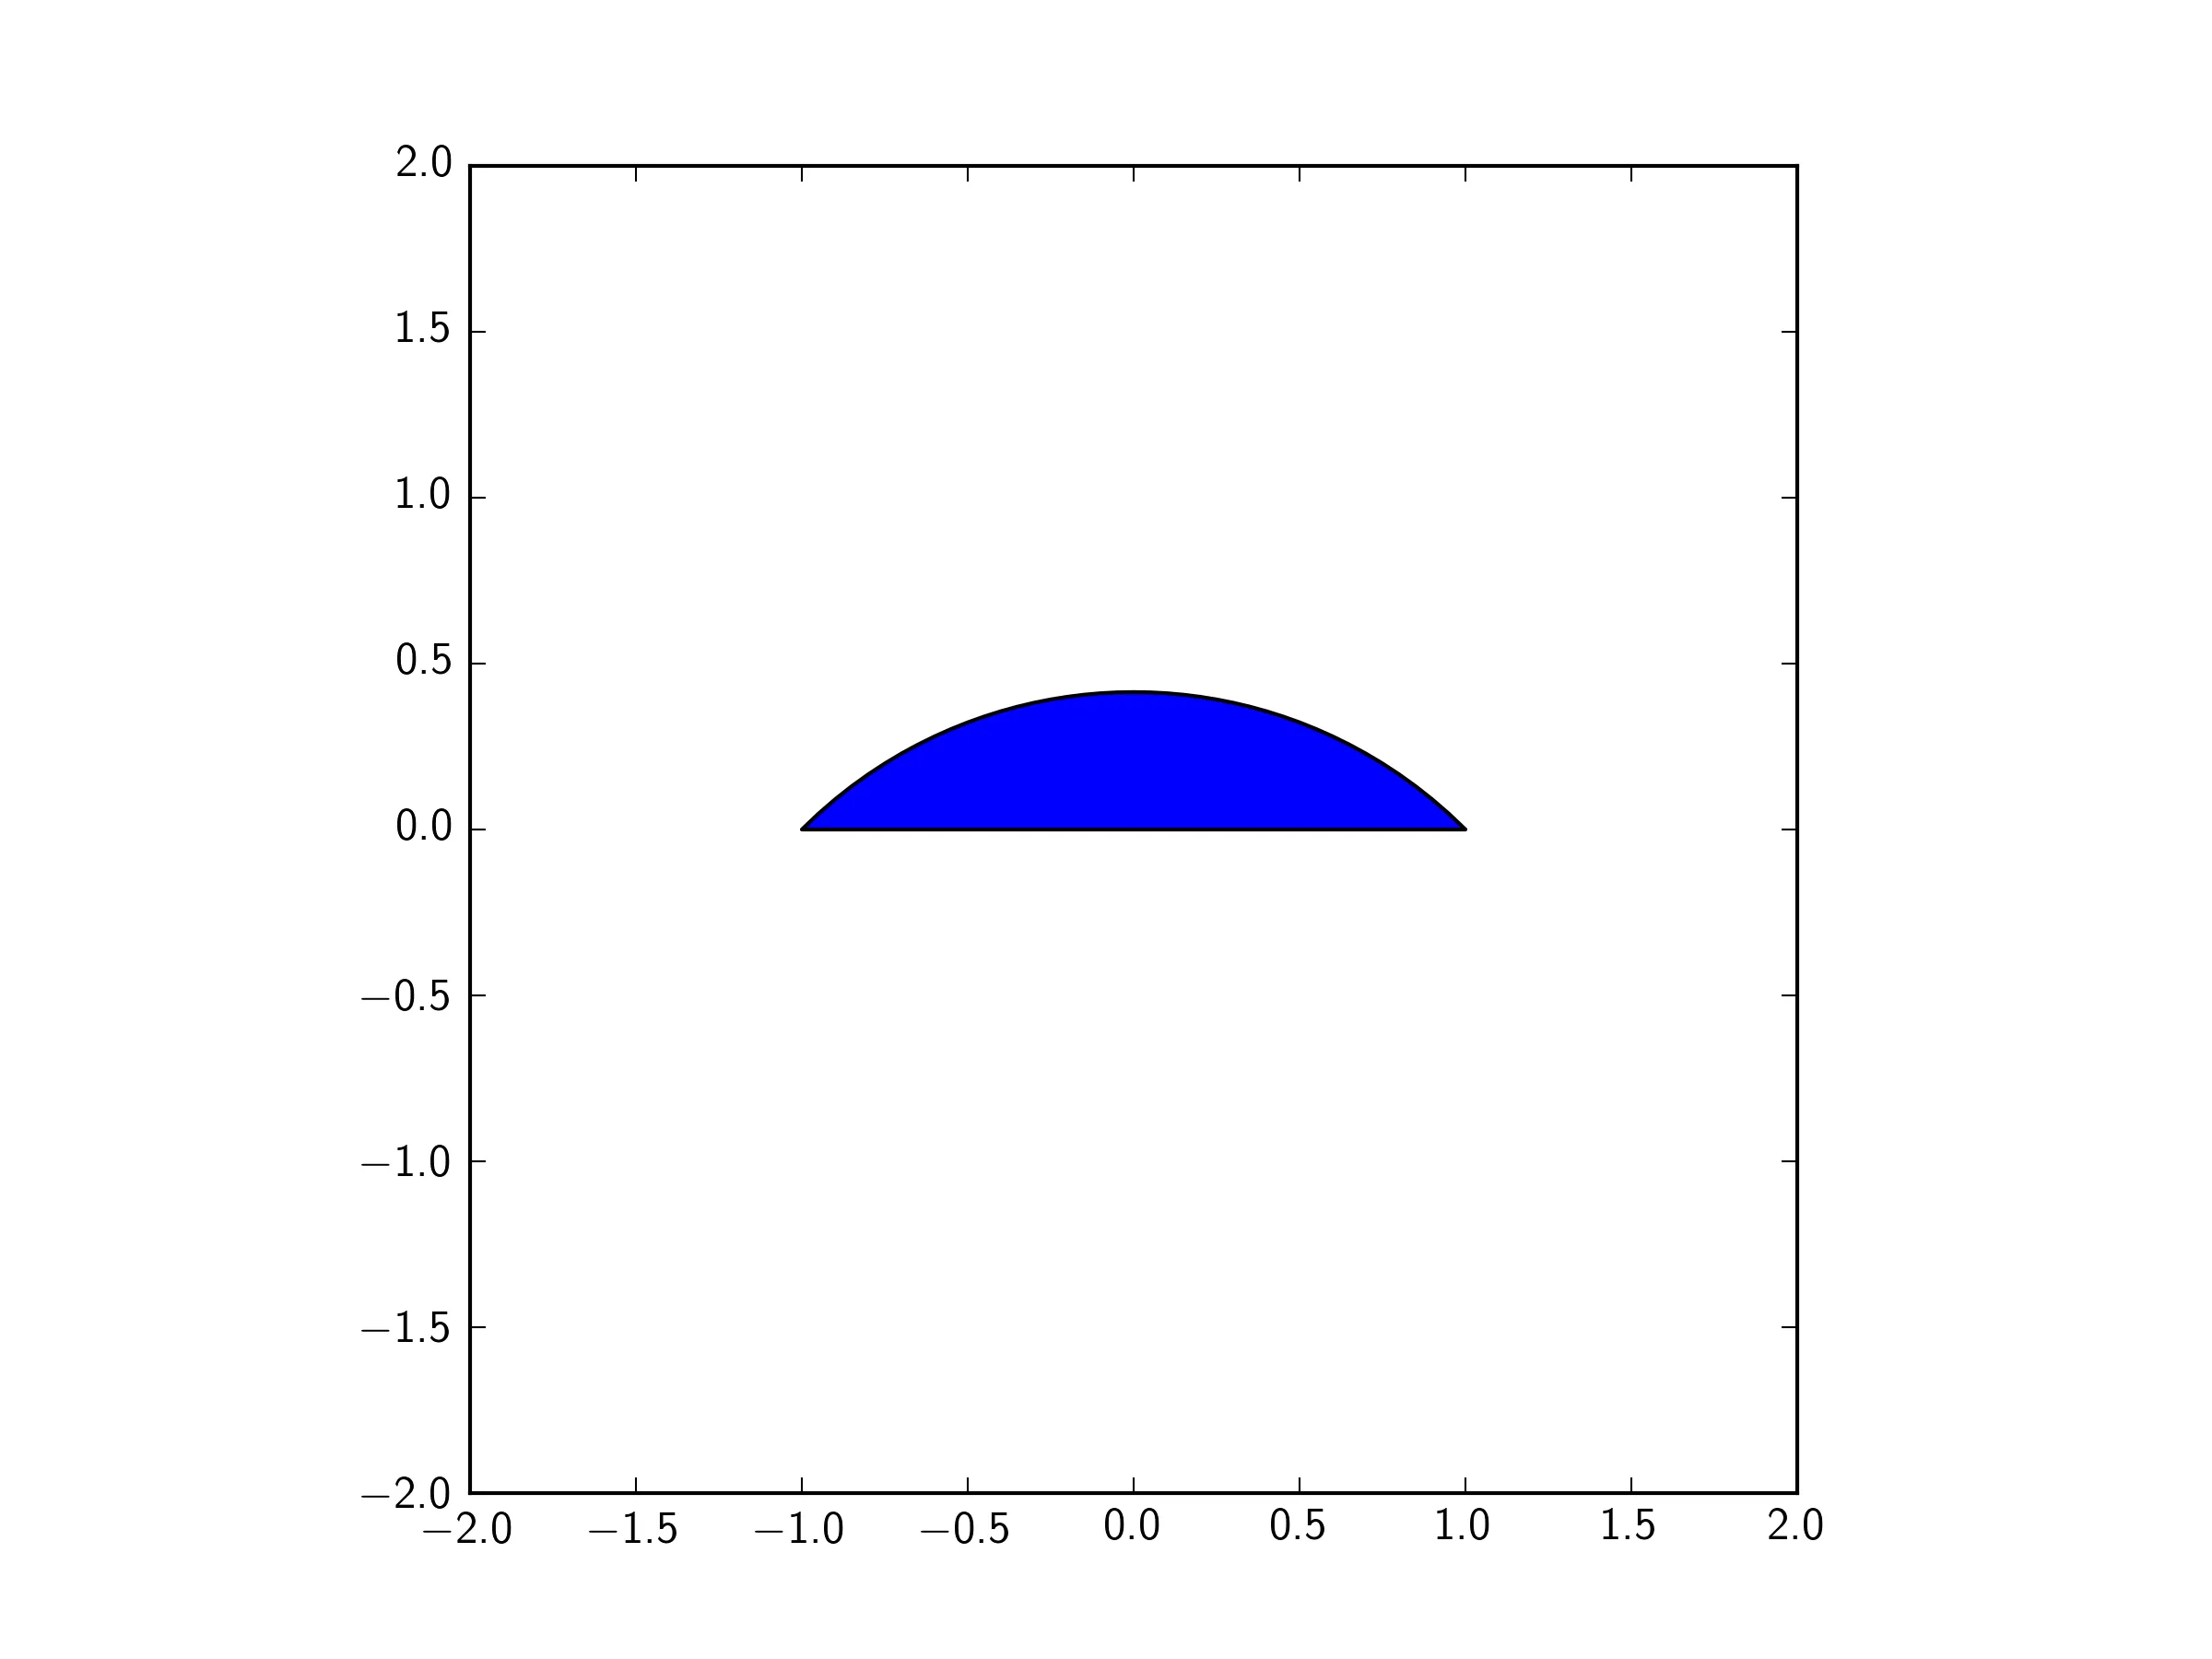
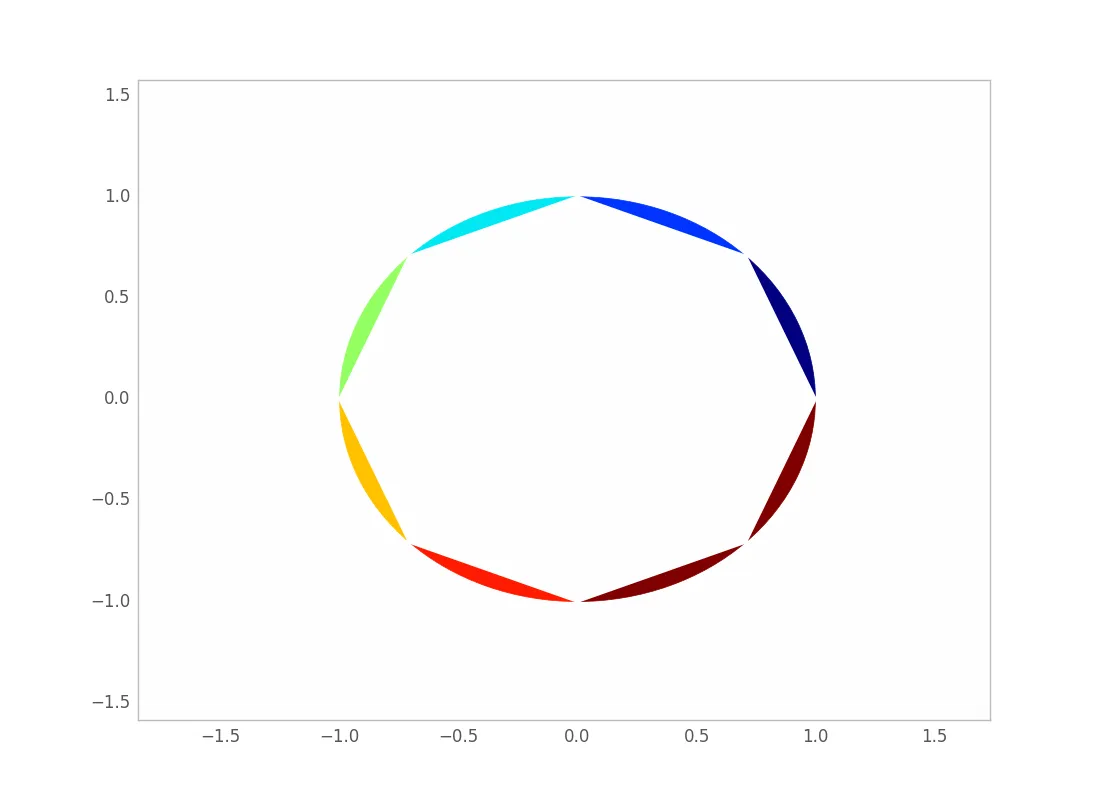
在Matplotlib中,我想绘制一个填充的弧形,它看起来像这样:

Filled Arc Example

以下代码将生成一个未填充的圆弧线:
import matplotlib.patches as mpatches
import matplotlib.pyplot as plt

fg, ax = plt.subplots(1, 1)

pac = mpatches.Arc([0, -2.5], 5, 5, angle=0, theta1=45, theta2=135)
ax.add_patch(pac)

ax.axis([-2, 2, -2, 2])
ax.set_aspect("equal")
fg.canvas.draw()

文档中说填充弧不可行。绘制弧的最佳方式是什么?

5个回答

15

jeanrjc的方案几乎可以解决问题,但它添加了一个完全不必要的白色三角形,这也会隐藏其他对象(请参见下面的图1)。

这是一个更简单的方法,只需添加一条圆弧的多边形:

基本上,我们创建一个沿着圆的边缘(从theta1到theta2)的点序列(points)。这已经足够了,因为我们可以在Polygon构造函数中设置close标志,它将添加从最后一个点到第一个点的线(创建一个封闭弧)。

import matplotlib.patches as mpatches
import matplotlib.pyplot as plt
import numpy as np

def arc_patch(center, radius, theta1, theta2, ax=None, resolution=50, **kwargs):
    # make sure ax is not empty
    if ax is None:
        ax = plt.gca()
    # generate the points
    theta = np.linspace(np.radians(theta1), np.radians(theta2), resolution)
    points = np.vstack((radius*np.cos(theta) + center[0], 
                        radius*np.sin(theta) + center[1]))
    # build the polygon and add it to the axes
    poly = mpatches.Polygon(points.T, closed=True, **kwargs)
    ax.add_patch(poly)
    return poly

然后我们应用它:

fig, ax = plt.subplots(1,2)

# @jeanrjc solution, which might hide other objects in your plot
ax[0].plot([-1,1],[1,-1], 'r', zorder = -10)
filled_arc((0.,0.3), 1, 90, 180, ax[0], 'blue')
ax[0].set_title('version 1')

# simpler approach, which really is just the arc
ax[1].plot([-1,1],[1,-1], 'r', zorder = -10)
arc_patch((0.,0.3), 1, 90, 180, ax=ax[1], fill=True, color='blue')
ax[1].set_title('version 2')

# axis settings
for a in ax:
    a.set_aspect('equal')
    a.set_xlim(-1.5, 1.5)
    a.set_ylim(-1.5, 1.5)

plt.show()

结果(版本2):

enter image description here


只是好奇,为什么要踩一下?这不是回答问题了吗? - hitzg
好的,我没有给你的回答点踩。相反,我很高兴你能改进我的解决方案,不过如果你能详细说明一下如何填充“points”,那就更好了。顺便说一句,如果你给我的回答点了踩,我看不出有什么理由。 - jrjc
不,我没有给你的投票点踩,事实上我会给它点赞。你的解决方案也很好,我喜欢你能够利用现有的功能(楔形)。还有一个人在恶意地踩投票(没有明显的原因)。 关于“points”的填充,你是对的,我会让这部分更简单。 - hitzg
感谢您在@jeanrc的回答中解决了遮盖问题(为避免上下投票问题:我给您+1)。 - Dietrich

10
你可以使用 fill_between 来实现这个功能。
 import matplotlib.patches as mpatches
 import matplotlib.pyplot as plt
 import numpy as np

 fg, ax = plt.subplots(1, 1)

 r=2.
 yoff=-1
 x=np.arange(-1.,1.05,0.05)
 y=np.sqrt(r-x**2)+yoff

 ax.fill_between(x,y,0)

 ax.axis([-2, 2, -2, 2])
 ax.set_aspect("equal")
 fg.canvas.draw()

通过调整r和yoff来移动弧线

enter image description here

编辑:

好的,所以你想能够绘制任意角度?你只需要找到弦的方程,而不是像上面那样使用平面直线。这里有一个可以做到这一点的函数:

import matplotlib.patches as mpatches
import matplotlib.pyplot as plt
import numpy as np

fg, ax = plt.subplots(1, 1)

col='rgbkmcyk'

def filled_arc(center,r,theta1,theta2):

    # Range of angles
    phi=np.linspace(theta1,theta2,100)

    # x values
    x=center[0]+r*np.sin(np.radians(phi))

    # y values. need to correct for negative values in range theta=90--270
    yy = np.sqrt(r-x**2)
    yy = [-yy[i] if phi[i] > 90 and phi[i] < 270 else yy[i] for i in range(len(yy))]

    y = center[1] + np.array(yy)

    # Equation of the chord
    m=(y[-1]-y[0])/(x[-1]-x[0])
    c=y[0]-m*x[0]
    y2=m*x+c

    # Plot the filled arc
    ax.fill_between(x,y,y2,color=col[theta1/45])

# Lets plot a whole range of arcs
for i in [0,45,90,135,180,225,270,315]:
    filled_arc([0,0],1,i,i+45)

ax.axis([-2, 2, -2, 2])
ax.set_aspect("equal")
fg.savefig('filled_arc.png')

这里是输出结果:

在此输入图片描述


只是好奇,为什么要踩这个问题?这个回答不正确吗? - tmdavison
1
我猜这是因为虽然你成功地以巧妙的方式重新创建了所需的形状,但它并不允许你从 theta1=0theta2=45 进行填充弧形。如果可以的话,请再描述一下。 - jrjc
你可以做到,只需要一点想象力。我现在会更新我的回答。 - tmdavison
fill_between() 是一个不错的想法。我只是隐含地要求坐标转换,所以它是有效的(为避免进一步的评级混淆:我给你+1)。 - Dietrich
1
希望更新后的答案能够让您进行坐标转换。谢谢! - tmdavison
显示剩余3条评论

6

这里有一个更简单的解决方案。在您的mpatches.Arc命令中使用hatch参数。如果您重复使用带有hatch参数的符号,则可以增加图案的密度。我发现如果您使用6个破折号“-”或6个点号“.”(其他可能也可以),则可以将弧线填充得更加均匀。当我运行此命令时

import matplotlib.patches as mpatches
import matplotlib.pyplot as plt 

plt.axes()
pac = mpatches.Arc([0, -2.5], 5, 5, 45, theta1=45, theta2=135, hatch = '......')
plt.gca().add_patch(pac)
pac.set_color('cyan')
plt.axis('equal')
plt.show()

我看到了这个:

弧形填充了密集的点阵图案,并旋转了45度,仅用于展示


这个解决方案与图像分辨率有关,足够的缩放总是可以注意到这些点。 - heracho
如果我没错的话,这是此线程中唯一填充椭圆弧而非圆弧的答案。 - heracho
Heracho,1)很遗憾,这是真的。这就是为什么我将其介绍为“更简单的解决方法”。不同的填充样式可以帮助使其看起来更厚。令人烦恼的是,边缘颜色与填充形状的伪实心颜色不匹配。2)看起来这个解决方案仍然是唯一一个使用mpatches.Arc的,所以我想你是对的! - Quebert

5
你可以画一个楔形,然后用三角形隐藏其中的一部分:
import matplotlib.patches as mpatches
import matplotlib.pyplot as plt
import numpy as np

def filled_arc(center, radius, theta1, theta2, ax, color):

    circ = mpatches.Wedge(center, radius, theta1, theta2, fill=True, color=color)
    pt1 = (radius * (np.cos(theta1*np.pi/180.)) + center[0],
           radius * (np.sin(theta1*np.pi/180.)) + center[1])
    pt2 = (radius * (np.cos(theta2*np.pi/180.)) + center[0],
           radius * (np.sin(theta2*np.pi/180.)) + center[1])
    pt3 = center
    pol = mpatches.Polygon([pt1, pt2, pt3], color=ax.get_axis_bgcolor(),
                           ec=ax.get_axis_bgcolor(), lw=2 )
    ax.add_patch(circ)
    ax.add_patch(pol)

然后你可以调用它:

fig, ax = plt.subplots(1,2)
filled_arc((0,0), 1, 45, 135, ax[0], "blue")
filled_arc((0,0), 1, 0, 40, ax[1], "blue")

你可以得到如下结果:

filled_arc

或者:

fig, ax = plt.subplots(1, 1)
for i in range(0,360,45):
    filled_arc((0,0), 1, i, i+45, ax, plt.cm.jet(i))

你会得到: 进入图像描述 希望对你有所帮助。

1
虽然在这个基本示例中可以完成任务,但如果您在图形中有其他艺术家想要置于弧形下方(因为白色三角形也会隐藏它们),则会产生意外的结果。 - hitzg
我喜欢将楔形和三角形结合的方法。正如@hitzg所指出的,可能会存在覆盖其他对象的问题。对于这些漂亮的图片,我给一个赞。 - Dietrich

0

在新版本的matplotlib中,需要将命令ax.get_axis_bgcolor()替换为ax.get_fc()


这不是一个答案,而是对另一个答案的评论。 - chrslg

网页内容由stack overflow 提供, 点击上面的
可以查看英文原文,
原文链接