我想使用
我尝试了这个 solution 和这个 solution,但对于
到目前为止,代码看起来像这样:
pandas.DataFrame.hist 绘制我的 DataFrame 的直方图,但我不想显示 y 轴刻度标签。我尝试了这个 solution 和这个 solution,但对于
pandas.DataFrame.hist 仍然不起作用。到目前为止,代码看起来像这样:
import pandas as pd
import matplotlib.pyplot as plt
df = pd.DataFrame({
'length': [1.5, 0.5, 1.2, 0.9, 3],
'width': [0.7, 0.2, 0.15, 0.2, 1.1]
}, index=['pig', 'rabbit', 'duck', 'chicken', 'horse'])
fig, ax = plt.subplots()
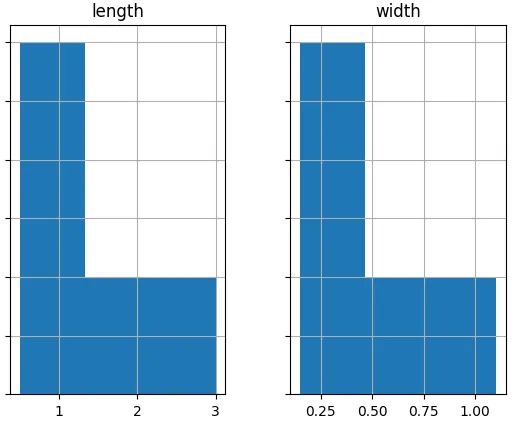
ax.axes.get_yaxis().set_visible(False)
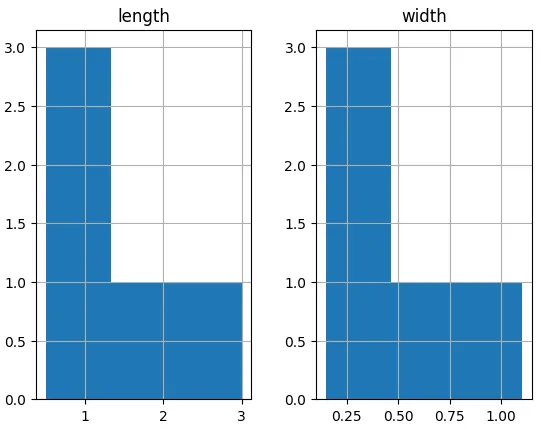
hist = df.hist(bins=3, ax=ax)
直方图如下: