假设我有一张带有黑色像素的图片。我知道所有黑色像素的坐标,现在我正在寻找黄色线。
已知:我的图片中黑色像素的坐标。
寻找:最适合黑色像素的黄色多项式。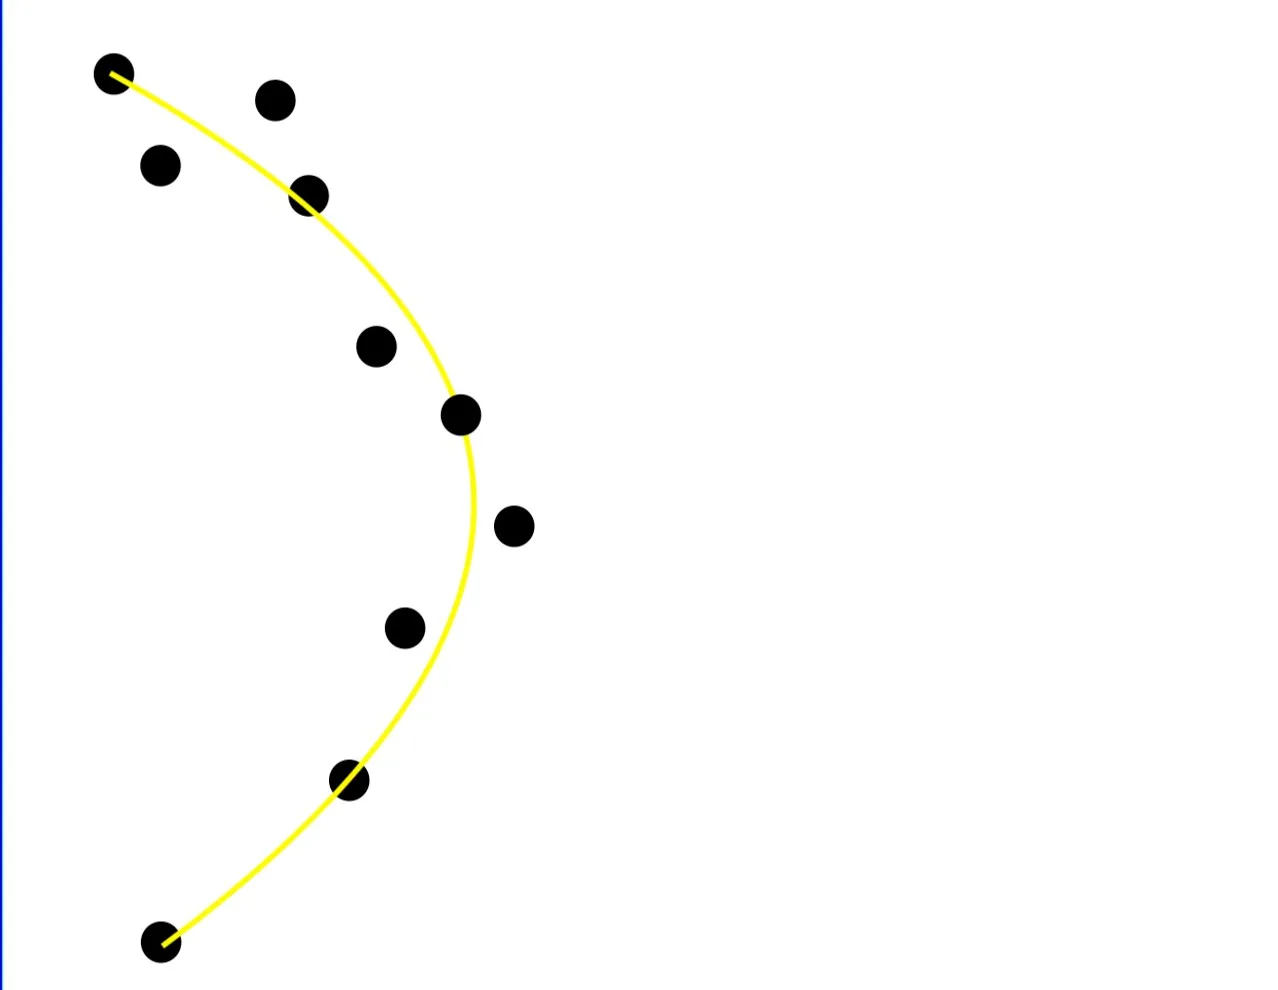
如果我理解正确,现在我用
编辑:
到目前为止这是我的代码:
感谢您的提前支持。
已知:我的图片中黑色像素的坐标。
寻找:最适合黑色像素的黄色多项式。
import cv2
import numpy as np

cv2.imread("foo.jpg")
#search for the black pixels and save the coordinates.

#coordinates of all pixels (example)
x = np.array([0.0, 1.0, 2.0, 3.0,  4.0,  5.0])
y = np.array([0.0, 0.8, 0.9, 0.1, -0.8, -1.0])
z = np.polyfit(x, y, 2)
p = np.poly1d(z)
如果我理解正确,现在我用
np.poly1d() 创建了一个多项式(图像上的黄线)。但是如何在我的bgr_img上绘制它呢?编辑:
到目前为止这是我的代码:
import cv2
import numpy as np
img = cv2.imread("white_foo.jpg") #1000x1000 pixel
#lets say these are my black pixels in a white image.
x = np.array([122, 224, 210, 350, 380, 250, 490, 623, 711, 819, 900])
y = np.array([536, 480, 390, 366, 270, 240, 180, 210, 280, 400, 501])
#calculate the coefficients.
z = np.polyfit(x, y, 2)
lspace = np.linspace(0, 1000, 100)
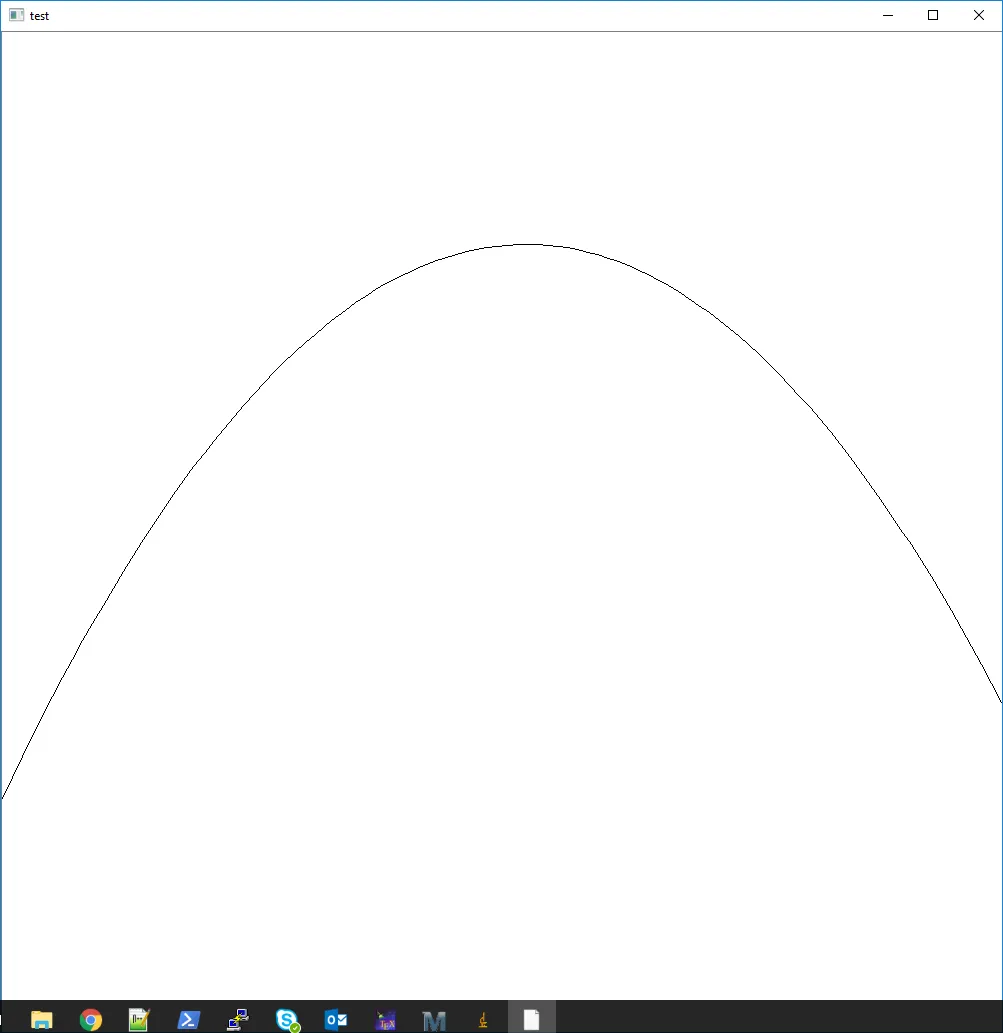
#here I want to draw the polynomial which I calculated with polyfit on my image
cv2.imshow("test", img)
cv2.waitKey(0)
感谢您的提前支持。