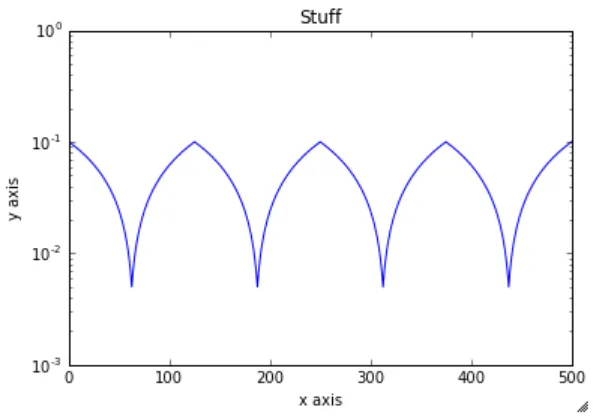
我希望能够绘制特定弧形形状的曲线,以下是我使用特定值所得到的结果(这些值需要使用),但它绘制的是直线。
我还在困扰于以我想要的方式格式化y轴。它是一个对数刻度,我希望它能达到1(如上图)。感谢您的帮助!=)
我希望能够绘制特定弧形形状的曲线,以下是我使用特定值所得到的结果(这些值需要使用),但它绘制的是直线。
我还在困扰于以我想要的方式格式化y轴。它是一个对数刻度,我希望它能达到1(如上图)。感谢您的帮助!=)
对数坐标图 不会使线段弯曲,只是将点放置在不同的刻度上,它们之间的线段仍然是直线。import matplotlib
import matplotlib.pyplot as plt
import numpy as np
from matplotlib.ticker import ScalarFormatter
# Data for plotting
t = [0.0, 62.5, 125.0, 187.5, 250, 312.5, 375, 437.5, 500]
s = [0.1, 0.005, 0.1, 0.005, 0.1, 0.005, 0.1, 0.005, 0.1]
def extendlist(l):
master = []
for i in range(len(l)-1):
x = np.linspace(l[i], l[i+1], 50)
master.extend(x)
return master
t = extendlist(t)
s = extendlist(s)
fig, ax = plt.subplots()
ax.semilogy(t, s)
ax.set(xlabel='x axis', ylabel='y axis', title='Stuff')
plt.xlim((0,500))
plt.ylim((0.001, 1))
plt.show()
import matplotlib.pyplot as plt
import numpy as np
from scipy.interpolate import interp1d

t = [0.0, 62.5, 125.0, 187.5, 250, 312.5, 375, 437.5, 500]
s = [0.1, 0.005, 0.1, 0.005, 0.1, 0.005, 0.1, 0.005, 0.1]
tnew = np.linspace(0, 500, num=1001, endpoint=True)
f = interp1d(t, s)
plt.semilogy(tnew, f(tnew))
plt.ylim((0.001, 1))
plt.show()
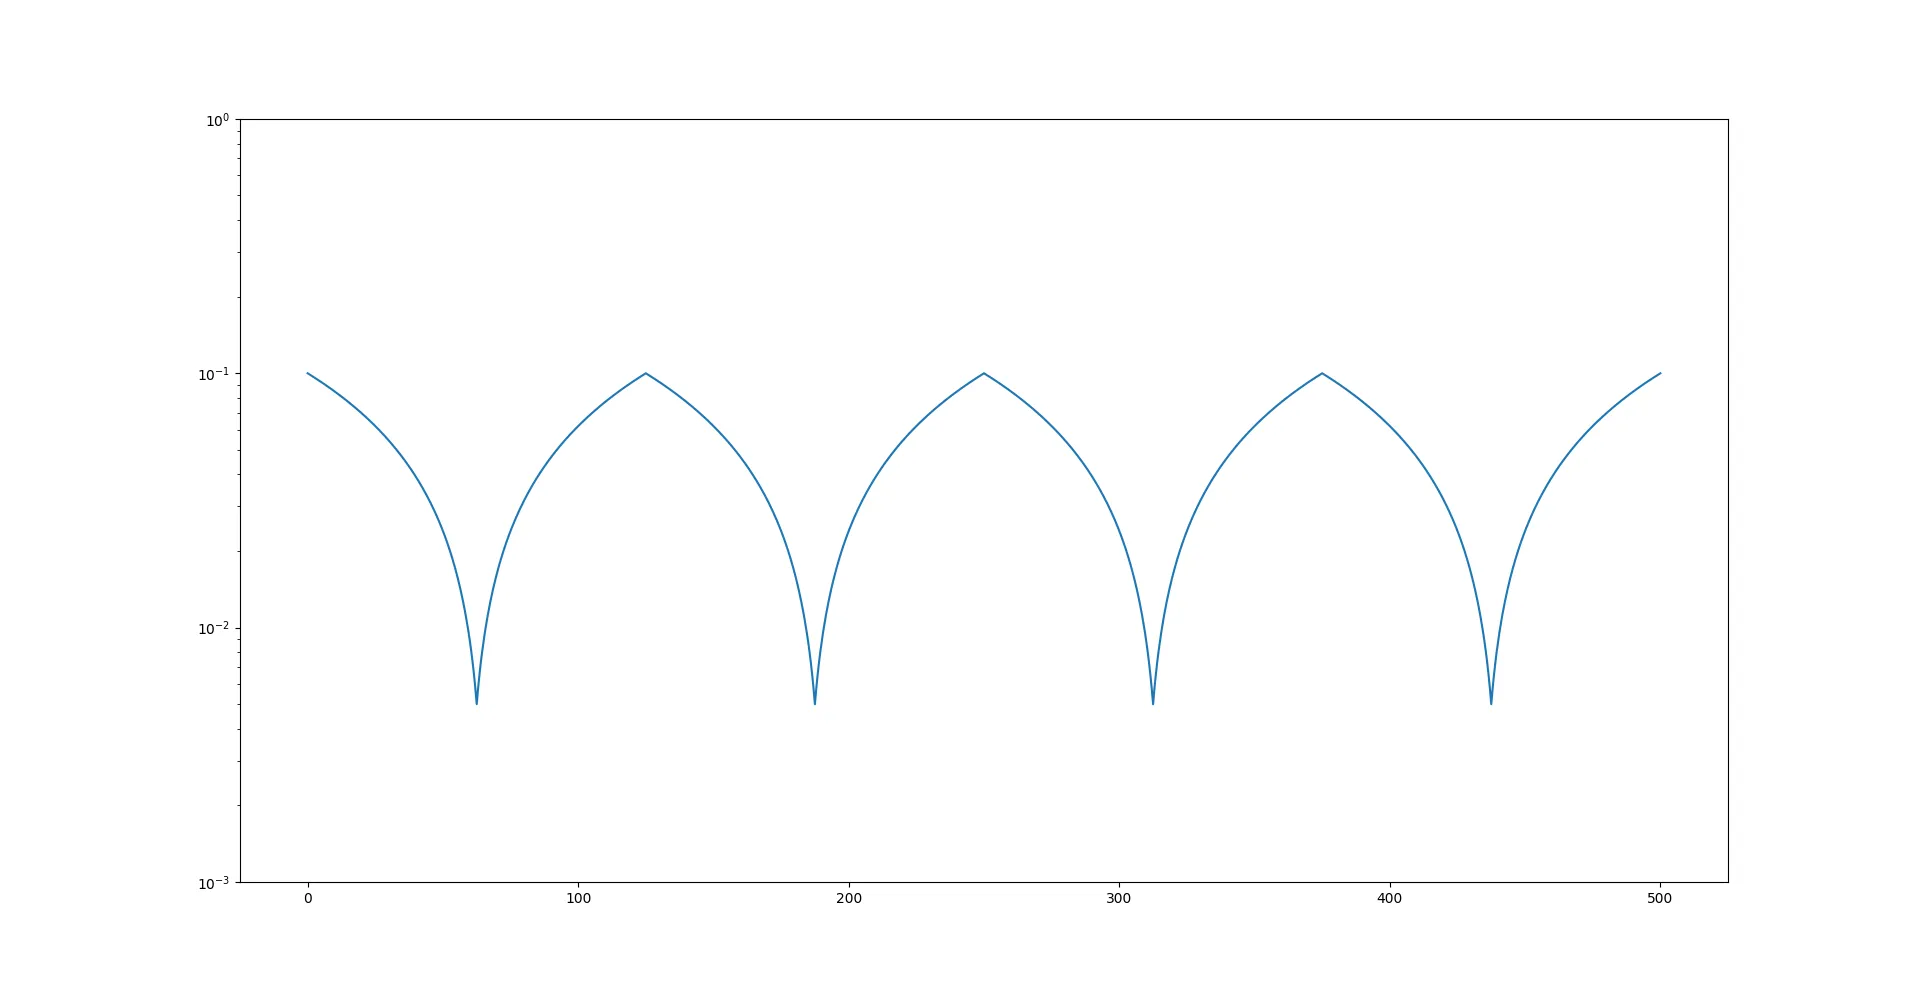
f是什么,interp又在哪里用到了? - ImportanceOfBeingErnest