我该如何使用Python找到并绘制类似以下的LOWESS曲线?
提前致谢。

提前致谢。
def lowess(x, y, f=1./3.):
"""
Basic LOWESS smoother with uncertainty.
Note:
- Not robust (so no iteration) and
only normally distributed errors.
- No higher order polynomials d=1
so linear smoother.
"""
# get some paras
xwidth = f*(x.max()-x.min()) # effective width after reduction factor
N = len(x) # number of obs
# Don't assume the data is sorted
order = np.argsort(x)
# storage
y_sm = np.zeros_like(y)
y_stderr = np.zeros_like(y)
# define the weigthing function -- clipping too!
tricube = lambda d : np.clip((1- np.abs(d)**3)**3, 0, 1)
# run the regression for each observation i
for i in range(N):
dist = np.abs((x[order][i]-x[order]))/xwidth
w = tricube(dist)
# form linear system with the weights
A = np.stack([w, x[order]*w]).T
b = w * y[order]
ATA = A.T.dot(A)
ATb = A.T.dot(b)
# solve the syste
sol = np.linalg.solve(ATA, ATb)
# predict for the observation only
yest = A[i].dot(sol)# equiv of A.dot(yest) just for k
place = order[i]
y_sm[place]=yest
sigma2 = (np.sum((A.dot(sol) -y [order])**2)/N )
# Calculate the standard error
y_stderr[place] = np.sqrt(sigma2 *
A[i].dot(np.linalg.inv(ATA)
).dot(A[i]))
return y_sm, y_stderr
import numpy as np
import matplotlib.pyplot as plt
# make some data
x = 5*np.random.random(100)
y = np.sin(x) * 3*np.exp(-x) + np.random.normal(0, 0.2, 100)
order = np.argsort(x)
#run it
y_sm, y_std = lowess(x, y, f=1./5.)
# plot it
plt.plot(x[order], y_sm[order], color='tomato', label='LOWESS')
plt.fill_between(x[order], y_sm[order] - 1.96*y_std[order],
y_sm[order] + 1.96*y_std[order], alpha=0.3, label='LOWESS uncertainty')
plt.plot(x, y, 'k.', label='Observations')
plt.legend(loc='best')
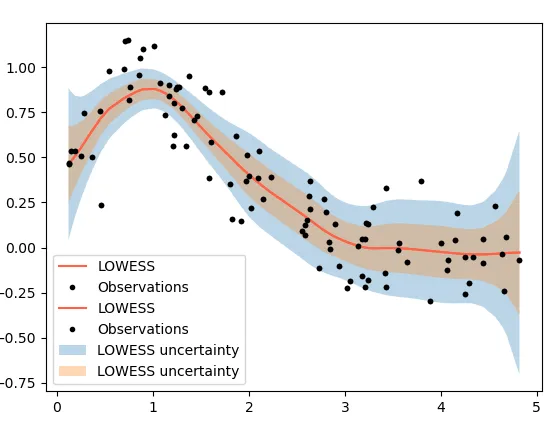
#run it
y_sm, y_std = lowess(x, y, f=1./5.)
# plot it
plt.plot(x[order], y_sm[order], color='tomato', label='LOWESS')
plt.fill_between(x[order], y_sm[order] - y_std[order],
y_sm[order] + y_std[order], alpha=0.3, label='LOWESS uncertainty')
plt.plot(x, y, 'k.', label='Observations')
plt.legend(loc='best')