如何在散点图中可视化非线性关系

9

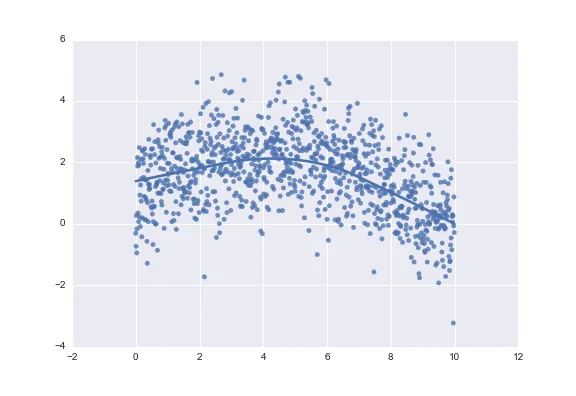
我希望能够通过视觉方式探索两个变量之间的关系。在密集的散点图中,这种关系的函数形式并不容易看出:

scatter plot

如何在Python中向散点图添加lowess平滑曲线?

或者您有什么其他建议来视觉探索非线性关系吗?

我尝试了以下方法,但它没有正常工作(参照 Michiel de Hoon的示例):

import numpy as np
from statsmodels.nonparametric.smoothers_lowess import lowess
x = np.arange(0,10,0.01)
ytrue = np.exp(-x/5.0) + 2*np.sin(x/3.0)

# add random errors with a normal distribution                      
y = ytrue + np.random.normal(size=len(x))
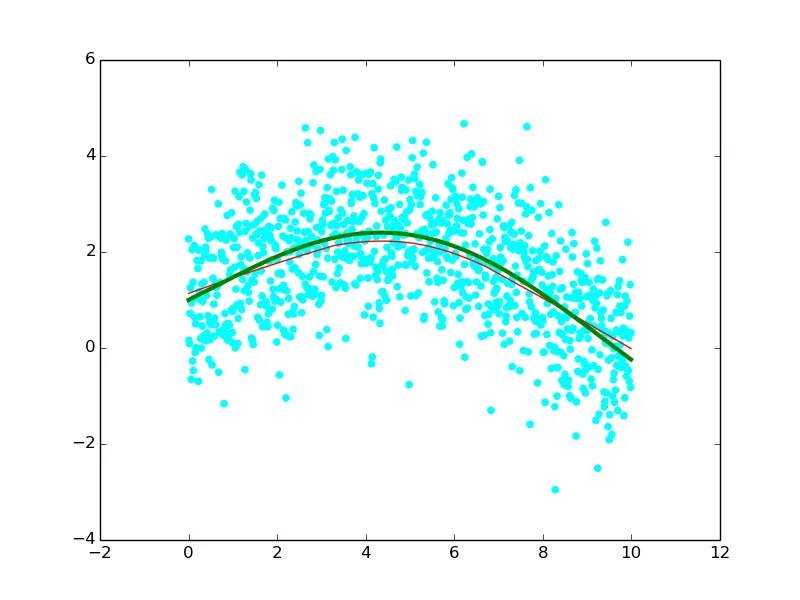
plt.scatter(x,y,color='cyan')

# calculate a smooth curve through the scatter plot
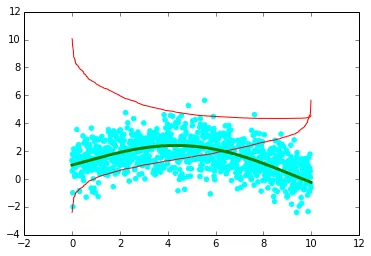
ys = lowess(x, y)
_ = plt.plot(x,ys,'red',linewidth=1)

# draw the true values for comparison
plt.plot(x,ytrue,'green',linewidth=3)

lowess

低通滤波器(红线)很奇怪。
编辑:
以下矩阵还包括低通平滑器(取自CV的这个问题):
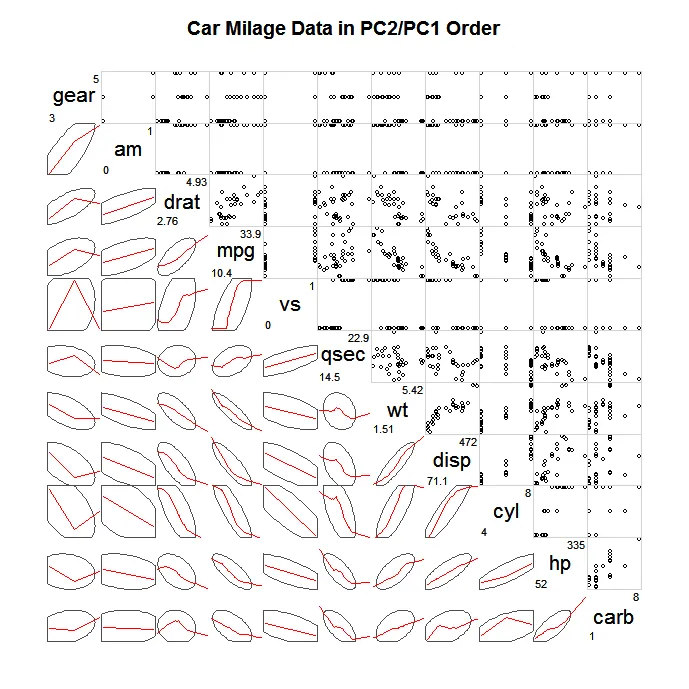
 enter image description here 有人有这样一个图形的代码吗?
2个回答

27

您还可以使用seaborn

import numpy as np
import seaborn as sns

x = np.arange(0, 10, 0.01)
ytrue = np.exp(-x / 5) + 2 * np.sin(x / 3)
y = ytrue + np.random.normal(size=len(x))

sns.regplot(x, y, lowess=True)

在这里输入图片描述


简单易懂! - Archie

11

来自 lowess 文档:

Definition: lowess(endog, exog, frac=0.6666666666666666, it=3, delta=0.0, is_sorted=False, missing='drop', return_sorted=True)

[...]

Parameters
----------
endog: 1-D numpy array
    The y-values of the observed points
exog: 1-D numpy array
    The x-values of the observed points

它接受其他顺序的参数。 它也不仅仅返回y:

>>> lowess(y, x)
array([[  0.00000000e+00,   1.13752478e+00],
       [  1.00000000e-02,   1.14087128e+00],
       [  2.00000000e-02,   1.14421582e+00],
       ..., 
       [  9.97000000e+00,  -5.17702654e-04],
       [  9.98000000e+00,  -5.94304755e-03],
       [  9.99000000e+00,  -1.13692896e-02]])

但如果你打电话

ys = lowess(y, x)[:,1]

你应该看到类似于:

示例lowess输出


网页内容由stack overflow 提供, 点击上面的
可以查看英文原文,
原文链接