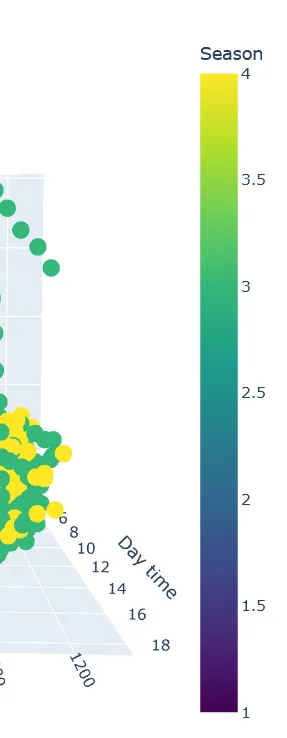
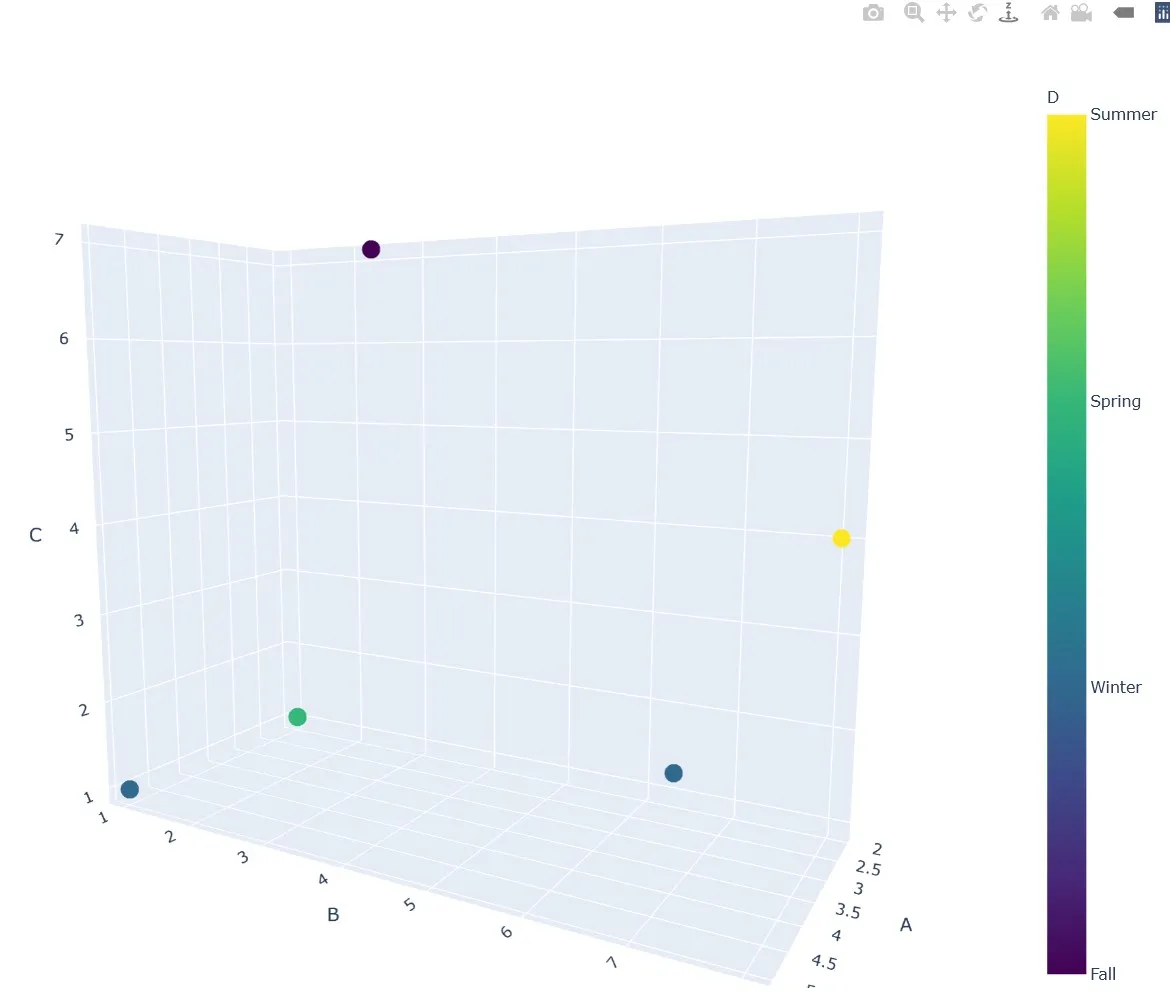
我正在使用plotly绘图,目前我已经得到了绘图结果。但是我使用的季节colormap,用1代表秋季,2代表冬季,...,4代表夏季。现在colormap不仅显示了这些数字,还显示1.5、2.5等。我想要展示名称而非数字。
我的代码:
import plotly.express as px
from plotly.offline import plot
import plotly
fig = px.scatter_3d(df, x=xlbl, y=ylbl, z=zlbl,
              color=wlbl,opacity=0,
              color_continuous_scale  = plotly.colors.sequential.Viridis)
temp_name = 'Temp_plot.html'
plot(fig, filename = temp_name, auto_open=False,
     image_width=1200,image_height=800)
plot(fig)
现有输出: