Python中LOWESS的置信区间

32

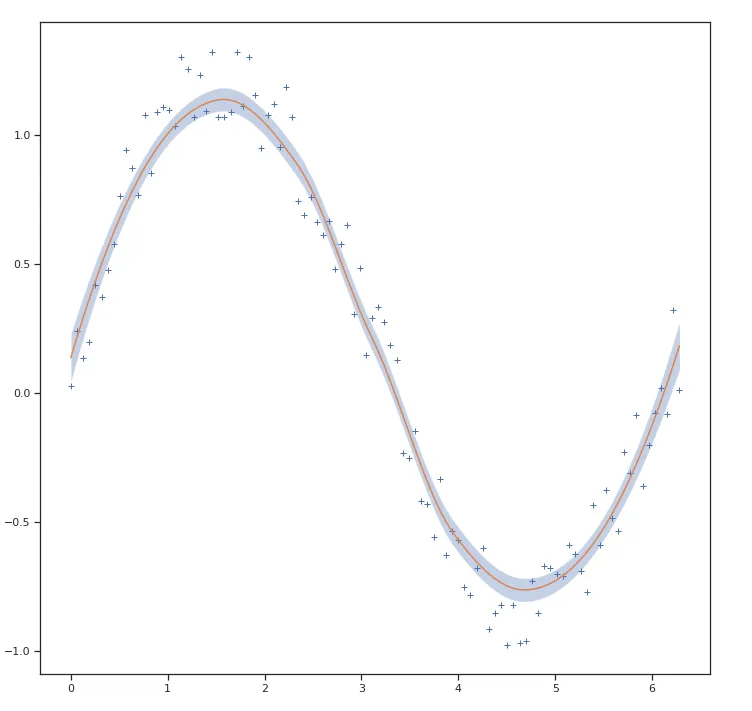
我该如何在Python中计算LOWESS回归的置信区间?我想将这些置信区间作为阴影区域添加到使用以下代码创建的LOESS图中(除了statsmodels之外的其他软件包也可以)。

import numpy as np
import pylab as plt
import statsmodels.api as sm

x = np.linspace(0,2*np.pi,100)
y = np.sin(x) + np.random.random(100) * 0.2
lowess = sm.nonparametric.lowess(y, x, frac=0.1)

plt.plot(x, y, '+')
plt.plot(lowess[:, 0], lowess[:, 1])
plt.show()
我在下面添加了一个带置信区间的示例图表,来自网站Serious Stats(使用R中的ggplot创建)。

enter image description here


1
statsmodels的lowess函数不会计算标准误差。 - Josef
7
更好的理由来提出这个问题… - Thriveth
3个回答

14

LOESS模型对于标准误差没有一个明确的概念,因为在这个上下文中它并没有意义。既然这样,你只能使用粗暴的方法。

对数据进行自助法重采样,对重复抽样得到的数据进行LOESS拟合,详见此页面中部的漂亮图片:http://statweb.stanford.edu/~susan/courses/s208/node20.html

enter image description here

一旦你有了大量不同的LOESS曲线,你可以找到X分位数的最高和最低值。

enter image description here


12

这是一个非常古老的问题,但它是谷歌搜索中最早出现的问题之一。您可以使用scikit-misc中的loess()函数来完成此操作。这是一个例子(我尝试保持您原始的变量名称,但我增加了噪音,以使其更加明显)

import numpy as np
import pylab as plt
from skmisc.loess import loess

x = np.linspace(0,2*np.pi,100)
y = np.sin(x) + np.random.random(100) * 0.4

l = loess(x,y)
l.fit()
pred = l.predict(x, stderror=True)
conf = pred.confidence()

lowess = pred.values
ll = conf.lower
ul = conf.upper

plt.plot(x, y, '+')
plt.plot(x, lowess)
plt.fill_between(x,ll,ul,alpha=.33)
plt.show()

结果:

带置信区间的 LOESS 平滑曲线


4
很遗憾,在Windows上似乎无法使用skmisc。 - RemiDav
很遗憾,到了2022年,Windows平台仍然没有这个可用。 - JoeTheShmoe

4
为了我的一个项目,我需要创建时间序列建模的间隔,并使该过程更加高效。因此我创建了tsmoothie:一个用于向量化时间序列平滑和异常值检测的 Python 库。
它提供了不同的平滑算法以及计算间隔的可能性。
在 LowessSmoother 的情况下:
import numpy as np
import matplotlib.pyplot as plt
from tsmoothie.smoother import *
from tsmoothie.utils_func import sim_randomwalk

# generate 10 randomwalks of length 200
np.random.seed(33)
data = sim_randomwalk(n_series=10, timesteps=200, 
                      process_noise=10, measure_noise=30)

# operate smoothing
smoother = LowessSmoother(smooth_fraction=0.1, iterations=1)
smoother.smooth(data)

# generate intervals
low, up = smoother.get_intervals('prediction_interval', confidence=0.05)

# plot the first smoothed timeseries with intervals
plt.figure(figsize=(11,6))
plt.plot(smoother.smooth_data[0], linewidth=3, color='blue')
plt.plot(smoother.data[0], '.k')
plt.fill_between(range(len(smoother.data[0])), low[0], up[0], alpha=0.3)

enter image description here

我还要指出,tsmoothie可以以向量化的方式平滑多个时间序列。希望这能帮助到某些人。

网页内容由stack overflow 提供, 点击上面的
可以查看英文原文,
原文链接