你可以指定一个
z-values列表来绘制等高线。因此,你需要收集适合你分布的正确的
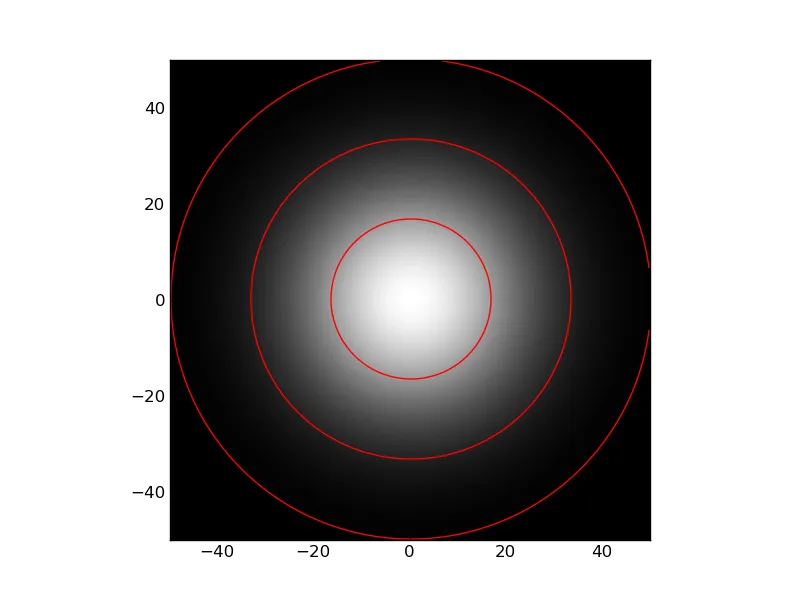
z-values。以下是一个示例,表示“从峰值处偏离1、2和3个标准差”:
代码:
import numpy as np
import matplotlib.cm as cm
import matplotlib.mlab as mlab
import matplotlib.pyplot as plt
delta = 0.025
x = np.arange(-3.0, 3.0, delta)
y = np.arange(-3.0, 3.0, delta)
X, Y = np.meshgrid(x, y)
sigma = 1.0
Z = mlab.bivariate_normal(X, Y, sigma, sigma, 0.0, 0.0)
z1 = mlab.bivariate_normal(0, 1 * sigma, sigma, sigma, 0.0, 0.0)
z2 = mlab.bivariate_normal(0, 2 * sigma, sigma, sigma, 0.0, 0.0)
z3 = mlab.bivariate_normal(0, 3 * sigma, sigma, sigma, 0.0, 0.0)
plt.figure()
im = plt.imshow(Z, interpolation='bilinear', origin='lower',
extent=(-50,50,-50,50),cmap=cm.gray)
CS = plt.contour(Z, [z1, z2, z3], origin='lower', extent=(-50,50,-50,50),colors='red')
plt.savefig('fig.png')
plt.show()