Matplotlib等高线图不起作用。

3
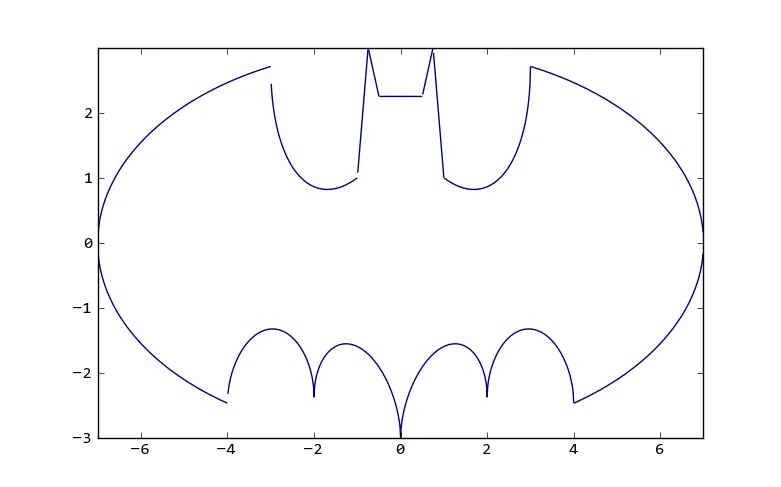
我正在尝试绘制蝙蝠侠方程。如果有sympy或matplotlib的解决方案将会很棒(因为我在使用Windows,所以sage不太适用)。问题是,如果我注释掉某些部分,图形的一部分就会出现,但是如果包括所有的F *=部分,我会得到一个空白图。
import matplotlib.pyplot
from numpy import arange
from numpy import meshgrid
from numpy import sqrt
from numpy import real

delta = 0.01
xrange = arange(-7.0, 7.0, delta)
yrange = arange(-3.0, 3.0, delta)
x, y = meshgrid(xrange,yrange)

F = 1
F *= (((x/7) ** 2) * sqrt(abs(abs(x) - 3)/(abs(x) - 3)) + ((y / 3) ** 2) * sqrt(abs(y + (3 * sqrt(33)) / 7)/(y + (3 * sqrt(33)) / 7)) - 1)
F *= (abs(x/2) - ((3 * sqrt(33) - 7)/112) * x**2 - 3 + sqrt(1 - (abs(abs(x) - 2) - 1) ** 2 ) - y)
F *= (9 * sqrt(abs((abs(x) - 1) * (abs(x) - 3/4))/((1 - abs(x)) * (abs(x) - 3/4))) - 8 * abs(x) - y)
F *= (3 * abs(x) + 0.75 * sqrt(abs((abs(x) - 3/4) * (abs(x) - 1/2))/((3/4 - abs(x)) * (abs(x) - 1/2))) - y)
F *= ((9/4) * sqrt(abs((x - 1/2) * (x + 1/2))/((1/2 - x) * (1/2 + x))) - y)
F *= ((6 * sqrt(10)) / 7 + (3/2 - abs(x)/2) * sqrt(abs(abs(x) - 1)/(abs(x) - 1)) - ((6 * sqrt(10))/ 14) * sqrt(4 - (abs(x) - 1) ** 2 ) - y)
G = 0

matplotlib.pyplot.contour(x, y, (F - G), [0])
matplotlib.pyplot.show()

这里发生了什么?如果一个乘数的图形为零,那么无论我投入哪些其他乘数,它仍应该保持为零。

蝙蝠侠方程的来源:http://www.reddit.com/r/pics/comments/j2qjc/do_you_like_batman_do_you_like_math_my_math/


你正在使用哪个版本的Python?如果不是3.x,那么你需要 from __future__ import division 来避免与所有这些整数一起进行地板除法。 - Paul
3个回答

9

对于许多点,sqrt的参数为负数,因此最终的产品都是NaN。您可以按以下方式绘制每个因子:

from __future__ import division  # this is important, otherwise 1/2 will be 0
import matplotlib.pyplot
from numpy import arange
from numpy import meshgrid
from numpy import sqrt
from numpy import real


delta = 0.01
xrange = arange(-7.0, 7.0, delta)
yrange = arange(-3.0, 3.0, delta)
x, y = meshgrid(xrange,yrange)

F1 = (((x/7) ** 2) * sqrt(abs(abs(x) - 3)/(abs(x) - 3)) + ((y / 3) ** 2) * sqrt(abs(y + (3 * sqrt(33)) / 7)/(y + (3 * sqrt(33)) / 7)) - 1)
F2 = (abs(x/2) - ((3 * sqrt(33) - 7)/112) * x**2 - 3 + sqrt(1 - (abs(abs(x) - 2) - 1) ** 2 ) - y)
F3 = (9 * sqrt(abs((abs(x) - 1) * (abs(x) - 3/4))/((1 - abs(x)) * (abs(x) - 3/4))) - 8 * abs(x) - y)
F4 = (3 * abs(x) + 0.75 * sqrt(abs((abs(x) - 3/4) * (abs(x) - 1/2))/((3/4 - abs(x)) * (abs(x) - 1/2))) - y)
F5 = ((9/4) * sqrt(abs((x - 1/2) * (x + 1/2))/((1/2 - x) * (1/2 + x))) - y)
F6 = ((6 * sqrt(10)) / 7 + (3/2 - abs(x)/2) * sqrt(abs(abs(x) - 1)/(abs(x) - 1)) - ((6 * sqrt(10))/ 14) * sqrt(4 - (abs(x) - 1) ** 2 ) - y)


for f in [F1,F2,F3,F4,F5,F6]:
    matplotlib.pyplot.contour(x, y, f, [0])
matplotlib.pyplot.show()

结果图表如下: enter image description here

很好,对于未来的除法也有很好的处理。我尝试使用numpy.lib.scimath.sqrt,它可以处理虚数,但是该函数在太多区域中定义,并且有一些无关的行。谢谢 :) - ubershmekel

0

我知道这可能看起来有些无聊,但是怎么样创建一个x值列表,然后计算在每个位置的“蝙蝠侠”值,并将其存储在另一个列表中。您可以定义一个函数“蝙蝠侠”,该函数计算每个传入的x值的y值。

然后只需使用matplotlib绘制这些列表即可。

编辑:由于您已经创建了numpy数组以存储结果,因此在计算y值时可以使用这些数组。


0

我甚至不确定这个方程式的工作原理,因为我看到在第一个项中(当abs(x)=3时,在第一个平方根下)会出现除以零的情况,并且在最后一项中(在最后一个平方根下,当{abs(x)-1}^2 > 4,即x > 3或x < -3时)会出现虚数。
我错过了什么吗?只使用结果的实部,忽略或近似于除以零的情况吗?

运行此程序,我确实看到很多RunTimeWarnings,很可能matplotlib会完全搞混要使用哪些数字(NaNs,Infs; 在末尾尝试打印F)。看起来它仍然可以处理相对较少的NaN或Inf,这就解释了为什么您只能看到图形的一部分。
我认为matplotlib的等高线是没问题的,只是输入数据有些混淆。


你如何获取警告信息,matplotlib是否有调试模式?不管怎样,我猜测虚数区域不应该被绘制(如果结果不为零...)。Matplotlib不支持虚数运算吗?除以零只影响一小部分点,可以忽略。 - ubershmekel
很有趣 - 我还没有看数学部分 :) - samb8s
我不知道任何调试模式;也许是我正在使用的matplotlib、numpy或python版本。看了上面的答案,我意识到问题所在:方程的每个部分都有一定数量的NaN和非NaN;matplotlib将绘制非NaN。然而,当乘以它们时,你最终得到所有的NaN,什么也没有被绘制。非常基本的例子:F1=[NaN, 5, NaN],F2=[NaN, NaN, 3],F3=[2, NaN, NaN];F1F2F3 = [NaN, NaN, NaN]。因此,你需要分别绘制它们。这与将某物乘以零无关,而是将某物乘以NaN。 - user707650

网页内容由stack overflow 提供, 点击上面的
可以查看英文原文,
原文链接