如何使用OpenCV在控制点上绘制曲线

5
我想在控制点上绘制曲线,以便我可以移动曲线来改变颜色。下面是代码,从一个非常好的解释答案中得到帮助。
const int N=5;      // number of control points (must be >= 4)
float ctrl[N]=      // control points y values initiated with linear function y=x
{           // x value is index*1.0/(N-1)
    0.00,
    0.25,
    0.50,
    0.75,
    1.00,
 };
float correction(float col,float *ctrl,int n)
    {
    float di=1.0/float(n-1);
    int i0,i1,i2,i3;
    float t,tt,ttt;
    float a0,a1,a2,a3,d1,d2;
    // find start control point
    col*=float(n-1);
    i1=col; col-=i1;
    i0=i1-1;
    i2=i1+1; if (i2>=n) i2=n-1;
    i3=i1+2;
    // compute interpolation coefficients
    if (i0>=0) d1=0.5*(ctrl[i2]-ctrl[i0]); else d1=ctrl[i2]-ctrl[i1];
    if (i3< n) d2=0.5*(ctrl[i3]-ctrl[i1]); else d2=ctrl[i2]-ctrl[i1];
    a0=ctrl[i1];
    a1=d1;
    a2=(3.0*(ctrl[i2]-ctrl[i1]))-(2.0*d1)-d2;
    a3=d1+d2+(2.0*(-ctrl[i2]+ctrl[i1]));
    // now interpolate new colro intensity
    t=col; tt=t*t; ttt=tt*t;
    t=a0+(a1*t)+(a2*tt)+(a3*ttt);
    return t;
    }


int main (int argc, const char** argv)
{
Mat input = imread ("E:\\img2.jpg");
Mat input1 = input;
for(int i=0 ; i<input1.rows ; i++)
{
    for (int p=0;p<input1.cols;p++)
    {

        input1.at<cv::Vec3b>(i,p)[0] = 255*correction(input1.at<cv::Vec3b>(i,p)[0]/255.0,ctrl,N);  //B
        input1.at<cv::Vec3b>(i,p)[1] = 255*correction(input1.at<cv::Vec3b>(i,p)[1]/255.0,ctrl,N);  //G
        input1.at<cv::Vec3b>(i,p)[2] = 255*correction(input1.at<cv::Vec3b>(i,p)[2]/255.0,ctrl,N);  //R

    }
}

imshow("image" , input);
waitKey();

}

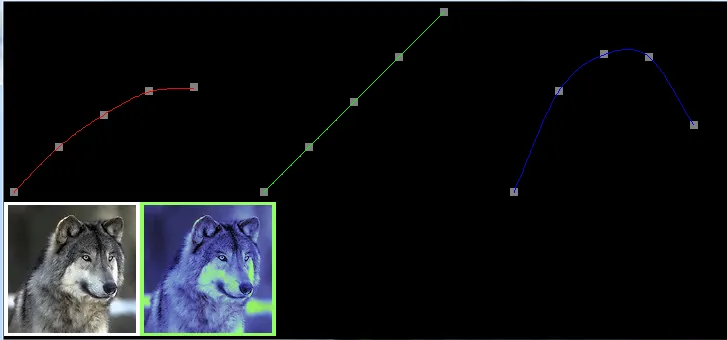
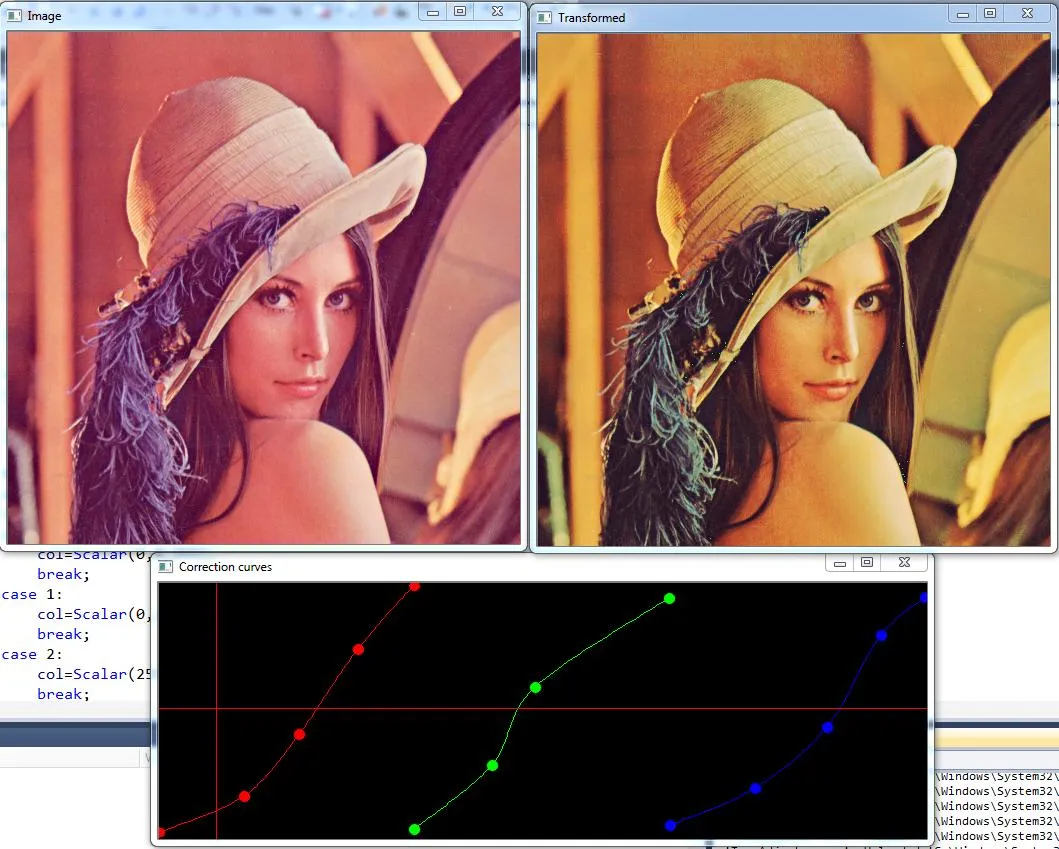
但是需要的输出结果就像下图所示的曲线一样:程序正在运行,但是曲线没有在我的屏幕上绘制出来,如何使用opencv或其他方法画出它们,这样这些线条就可以扮演图像中特定颜色的角色,并带有它们的值,如下图所示右侧的图像是原始图像,左侧的图像是通过曲线更改值的结果,下面的曲线是每个B,G,R控制点

enter image description here


好的。您的实际问题是什么?曲线有什么问题吗?它们不够平滑(您可能需要增加控制点的数量)。 - Froyo
程序正在运行,但曲线没有在屏幕上绘制出来。如何使用OpenCV或其他方法绘制它们? - AHF
哦,但我们确实看到了曲线,对吧?你是如何画出这些曲线的? - berak
那不是我画的 :(,那是来自其他问题,我链接的那个人使用其他工具。 - AHF
他使用了“Simple for (t=0;t<=1;t+=0.01) loop with Canvas->LineTo(t,correction(t,ctrl,5));”,但我只在OpenCV中看到了“createTrackbar”。 - AHF
1个回答

12
此代码示例允许您使用鼠标编辑样条曲线,它使用来自此链接(附加到您的项目:overhauser.cpp、overhauser.hpp和vec3.hpp)的文件:
左键添加/移动点,右键删除。 enter image description here
#include <iostream>
#include <vector>
#include <stdio.h>
#include <functional>
#include <algorithm>
#include <numeric>
#include <cstddef>
#include "opencv2/opencv.hpp"
#include <iostream>
#include <fstream>
#include "overhauser.hpp"

using namespace std;
using namespace cv;

Mat result;
Mat Img;

int current_color=0;

vector<cv::Point2f> pts_red;
vector<cv::Point2f> pts_green;
vector<cv::Point2f> pts_blue;

Mat curvesImg;
int selectedPt=-1;

CRSpline* spline_red = 0;
CRSpline* spline_green = 0;
CRSpline* spline_blue = 0;

unsigned char LUT_RED[256];
unsigned char LUT_GREEN[256];
unsigned char LUT_BLUE[256];

// comparison function:
bool mycomp (Point2f p1, Point2f p2)
{
    return p1.x<p2.x;
}

float dist(Point2f p1,Point2f p2)
{
    return sqrt((p1.x-p2.x)*(p1.x-p2.x)+(p1.y-p2.y)*(p1.y-p2.y));
}

int findNEarestPt(Point2f pt, float maxDist)
{   
    vector<Point2f> current_pts_set;

    current_color=0;

    if(pt.x>255 && pt.x<512)
    {
        current_color=1;
    }

    if(pt.x>=512)
    {
        current_color=2;
    }

    float ptx=pt.x;

    switch(current_color)
    {
    case 0:
        current_pts_set=pts_red;
        break;
    case 1:
        current_pts_set=pts_green;
        pt.x-=255;
        break;
    case 2:
        current_pts_set=pts_blue;
        pt.x-=511;
        break;
    }

    float minDist=FLT_MAX;
    int ind=-1;
    for(int i=0;i<current_pts_set.size();++i)
    {
        float d=dist(pt,current_pts_set[i]);
        if(minDist>d)
        {
            ind=i;
            minDist=d;
        }
    }
    if(minDist>maxDist)
    {
        ind=-1;
    }

    return ind;
}

float F(float t,float x, CRSpline* spline)
{
    vec3 rv = spline->GetInterpolatedSplinePoint(t);
    return x-rv.x;
}

float solveForX(float x,CRSpline* slpine)
{
    float a=-1.0f,b=1.0,c,e=1e-2;
    c=(a+b)/2;
    while( (fabs(b-a)>e) && (F(c,x,slpine)!=0) )
    {
        if (F(a,x,slpine)*F(c,x,slpine)<0)
        {
            b=c;
        }
        else
        {
            a=c;
        }
        c=(a+b)/2;
    }
    return c;
}


int ind=-1;

void mouseHandler(int event, int x, int y, int flags, void* param)
{
    Point2f m;
    m.x=x;
    m.y=y;
    curvesImg=Scalar(0,0,0);

    switch (event)
    {
    case cv::EVENT_RBUTTONDOWN:
        ind=findNEarestPt(m,5);
        if (ind==-1)
        {

        }else
        {
            switch(current_color)
            {
            case 0:
                pts_red.erase(pts_red.begin()+ind);
                break;
            case 1:
                pts_green.erase(pts_green.begin()+ind);
                break;
            case 2:
                pts_blue.erase(pts_blue.begin()+ind);
                break;
            }
            ind=-1;
        }
        break;

    case cv::EVENT_LBUTTONDOWN:
        ind=findNEarestPt(m,5);
        if (ind==-1)
        {
            switch(current_color)
            {
            case 0:
                pts_red.push_back(m);
                selectedPt=pts_red.size()-1;
                break;
            case 1:

                pts_green.push_back(Point2f(m.x-255.0,m.y));
                selectedPt=pts_green.size()-1;
                break;
            case 2:
                pts_blue.push_back(Point2f(m.x-511,m.y));
                selectedPt=pts_blue.size()-1;
                break;
            }
        }else
        {
            selectedPt=ind;
        }
        break;

    case cv::EVENT_MOUSEMOVE:
        if(ind!=-1)
        {
            switch(current_color)
            {
            case 0:
                pts_red[selectedPt].x=m.x;
                pts_red[selectedPt].y=m.y;
                break;
            case 1:
                pts_green[selectedPt].x=m.x-255;
                pts_green[selectedPt].y=m.y;
                break;
            case 2:
                pts_blue[selectedPt].x=m.x-511;
                pts_blue[selectedPt].y=m.y;
                break;
            }
        }
        break;
    case cv::EVENT_LBUTTONUP:
        ind=-1;
        break;
    }

    std::sort(pts_red.begin(),pts_red.end(),mycomp);
    if(pts_red.size()>0)
    {
        pts_red[pts_red.size()-1].x=255;
        pts_red[0].x=0;
    }

    std::sort(pts_green.begin(),pts_green.end(),mycomp);
    if(pts_green.size()>0)
    {
        pts_green[pts_green.size()-1].x=255;
        pts_green[0].x=0;
    }

    std::sort(pts_blue.begin(),pts_blue.end(),mycomp);
    if(pts_blue.size()>0)
    {
        pts_blue[pts_blue.size()-1].x=255;
        pts_blue[0].x=0;
    }

    for(int i=0;i<pts_red.size();++i)
    {
        circle(curvesImg,pts_red[i],5,Scalar(0,0,255),-1,CV_AA);
    }

    for(int i=0;i<pts_green.size();++i)
    {
        circle(curvesImg,Point2f(pts_green[i].x+255,pts_green[i].y),5,Scalar(0,255,0),-1,CV_AA);
    }

    for(int i=0;i<pts_blue.size();++i)
    {
        circle(curvesImg,Point2f(pts_blue[i].x+511,pts_blue[i].y),5,Scalar(255,0,0),-1,CV_AA);
    }

    if (spline_red) {delete spline_red;}
    spline_red = new CRSpline();

    if (spline_green) {delete spline_green;}
    spline_green = new CRSpline();

    if (spline_blue) {delete spline_blue;}
    spline_blue = new CRSpline();

    for (int i=0;i<pts_red.size();++i)
    {
        vec3 v(pts_red[i].x,pts_red[i].y,0);
        spline_red->AddSplinePoint(v);
    }

    for (int i=0;i<pts_green.size();++i)
    {
        vec3 v(pts_green[i].x,pts_green[i].y,0);
        spline_green->AddSplinePoint(v);
    }

    for (int i=0;i<pts_blue.size();++i)
    {
        vec3 v(pts_blue[i].x,pts_blue[i].y,0);
        spline_blue->AddSplinePoint(v);
    }

    vec3 rv_last(0,0,0);
    if(pts_red.size()>2)
    {
        for(int i=0;i<256;++i)
        {
            float t=solveForX(i,spline_red);
            vec3 rv = spline_red->GetInterpolatedSplinePoint(t);
            if(rv.y>255){rv.y=255;}
            if(rv.y<0){rv.y=0;}
            unsigned char I=(unsigned char)(rv.y);
            LUT_RED[i]=255-I;
            if(i>0)
            {
                line(curvesImg,Point(rv.x,rv.y),Point(rv_last.x,rv_last.y),Scalar(0,0,255),1);
            }
            rv_last=rv;
        }
    }
    rv_last=vec3(0,0,0);
    if(pts_green.size()>2)
    {
        for(int i=0;i<256;++i)
        {
            float t=solveForX(i,spline_green);
            vec3 rv = spline_green->GetInterpolatedSplinePoint(t);
            if(rv.y>255){rv.y=255;}
            if(rv.y<0){rv.y=0;}
            unsigned char I=(unsigned char)(rv.y);
            LUT_GREEN[i]=255-I;
            if(i>0)
            {
                line(curvesImg,Point(rv.x+255,rv.y),Point(rv_last.x+255,rv_last.y),Scalar(0,255,0),1);
            }
            rv_last=rv;
        }
    }
    rv_last=vec3(0,0,0);
    if(pts_blue.size()>2)
    {
        for(int i=0;i<256;++i)
        {
            float t=solveForX(i,spline_blue);
            vec3 rv = spline_blue->GetInterpolatedSplinePoint(t);
            if(rv.y>255){rv.y=255;}
            if(rv.y<0){rv.y=0;}
            unsigned char I=(unsigned char)(rv.y);
            LUT_BLUE[i]=255-I;
            if(i>0)
            {
                line(curvesImg,Point(rv.x+511,rv.y),Point(rv_last.x+511,rv_last.y),Scalar(255,0,0),1);
            }
            rv_last=rv;
        }

    }

    int cur_col=0;

    if(m.x>255 && m.x<512)
    {
        cur_col=1;
    }

    if(m.x>=512)
    {
        cur_col=2;
    }

    Scalar col;
    switch(cur_col)
    {
    case 0:
        col=Scalar(0,0,255);
        break;
    case 1:
        col=Scalar(0,255,0);
        break;
    case 2:
        col=Scalar(255,0,0);
        break;
    }
    line(curvesImg,Point(0,m.y),Point(curvesImg.cols,m.y),col,1);
    line(curvesImg,Point(m.x,0),Point(m.x,curvesImg.rows),col,1);

    imshow("Correction curves",curvesImg);  

    vector<Mat> ch;
    cv::split(Img,ch);
    LUT(ch[0],Mat(256,1,CV_8UC1,LUT_BLUE),ch[0]);
    LUT(ch[2],Mat(256,1,CV_8UC1,LUT_RED),ch[2]);
    LUT(ch[1],Mat(256,1,CV_8UC1,LUT_GREEN),ch[1]);
    cv::merge(ch,result);

    imshow("Transformed",result);   
}
// ---------------------------------
// 
// ---------------------------------
//==============================================================================

int main( int argc, char** argv )
{

    for (int i=0;i<256;++i)
    {
        LUT_RED[i]=i;
        LUT_GREEN[i]=i;
        LUT_BLUE[i]=i;
    }

    namedWindow("Image");
    namedWindow("Correction curves");
    namedWindow("Transformed");

    Img=imread("D:\\ImagesForTest\\lena.jpg",1);

    imshow("Image",Img);

    curvesImg=Mat::zeros(256,768,CV_8UC3);
    setMouseCallback("Correction curves", mouseHandler, NULL);
    waitKey(0);

    getchar();
}

谢谢 :). 看起来我应该交换x和y轴。 - Andrey Smorodov
@AndreySmorodov,掌握颜色的最佳方法是什么?我在问题上面所遵循的方法是立方体,而你的方法是Catmull-Rom? - AHF
1
我想说的是看看你的结果图像,有两个形状,一个是原始的(没有红色),另一个是遵循曲线和着色的。因此,如果我有正确的图像(没有红色),并且我想将其转换为左侧的图像(红色着色)并带有曲线,但当我通过曲线获得它时,我想保存曲线的值,然后下一次只需将该值乘以图像即可获得结果图像,而无需绘制曲线,就像我们对棕褐色滤镜所做的那样,我们将.131、.534、.272、.168、.686、.349、.189、.769、.393这些值与原始图像相乘,我们将获得棕褐色。 - AHF
不是乘法,而是应用查找表变换。这意味着您获取像素值(例如val=120),然后从LUT表中获取新值(例如val_new=Lut[val]),并将新值放置在像素位置上。为了保存转换规则,您需要保存LUT值。 - Andrey Smorodov
1
Ough :) 只需复制它三次 :). 我已经为您做好了。 - Andrey Smorodov
显示剩余9条评论

网页内容由stack overflow 提供, 点击上面的
可以查看英文原文,
原文链接