I希望使用
一个技巧是使用
我说明我的问题。
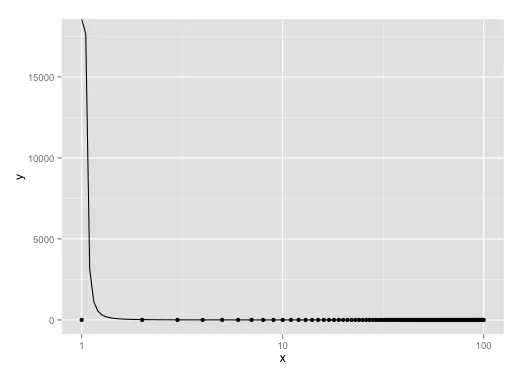
创建一些示例数据和基本图:
这可能与我需要调整函数以反转比例尺的效果有关,但我还无法完全理解。
ggplot2来可视化遵循幂函数曲线的一些数据。这个问题以前已经被问过了(Add exp/power trend line to a ggplot),但是答案并没有真正帮助到我。一个技巧是使用
stat_function()来创建曲线。然而,我无法使stat_function()和我的幂函数曲线在对数刻度下工作。我说明我的问题。
创建一些示例数据和基本图:
library(ggplot2)
x <- 1:100
pwr <- function(x)x^-2.5
dat <- data.frame(x, y = pwr(x))
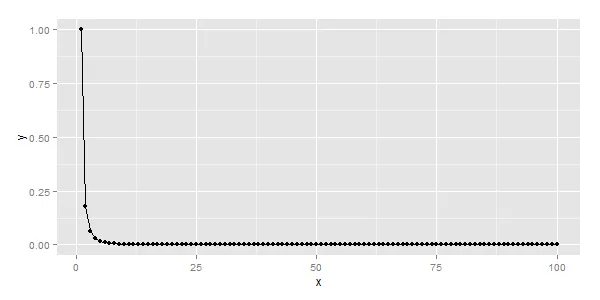
p <- ggplot(dat, aes(x = x, y = y)) +
geom_point()
p + stat_function(fun = pwr)
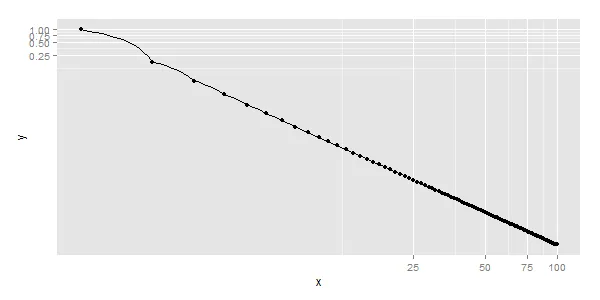
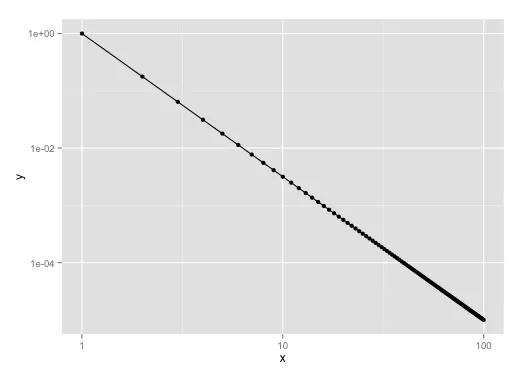
很好,让我们使用coord_trans()添加一些对数刻度。这完美地起作用,只是我的直线不再是直的了(正如文档告诉我所期望的那样)。
p + stat_function(fun = pwr) + coord_trans(x = "log10", y = "log10")
因此,请再次尝试使用coord_x_log10()和coord_y_log10(),但是这会引发错误:
p + stat_function(fun = pwr) + scale_x_log10() + scale_y_log10()

Error in seq.default(min, max, by = by) :
  'from' cannot be NA, NaN or infinite
这可能与我需要调整函数以反转比例尺的效果有关,但我还无法完全理解。
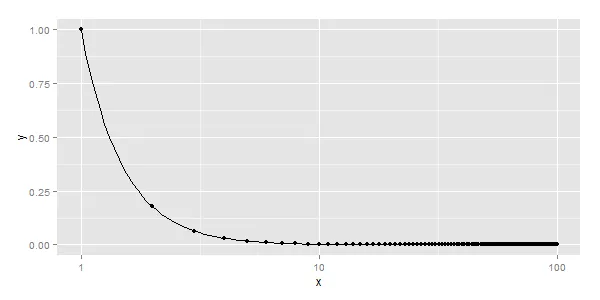
只有对数x轴比例尺时,我才能做到:
p + scale_x_log10() + stat_function(fun = function(x)pwr(10^x))
scale_y_log10(),我不知道如何转换y值。可能是我缺少一些基本的东西。有没有简单的方法来绘制这条曲线?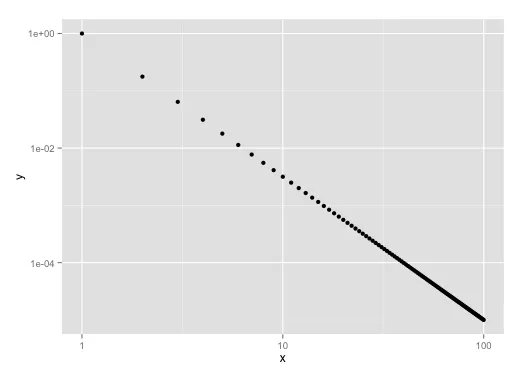
ggplot2这个部分不是决定性因素,那么有一个叫做poweRlaw的包可以实现这个功能:https://cran.r-project.org/web/packages/poweRlaw/index.html。 - ulfelderscale_x_log10(limits = c(1, 200)) + scale_y_log10(limits = c(1e-5, 1))。然而,stat_function与轴变换不兼容:https://dev59.com/CWDVa4cB1Zd3GeqPfrHm - Rolandgeom_point()使用数据框绘制点。stat_function()不会触及底层数据,而只使用函数。我认为它们不会相互干扰。 - Andrieggplot(dat, aes(x = x, y = y)) + geom_point() + coord_trans(ytrans = "log10", xtrans = "log10")...这不是你想要的吗? - Brandon Bertelsen