给 ggplot 添加指数/幂趋势线

7
我希望在我的图表中添加一个指数(+幂)趋势线。我正在使用ggplot2包。
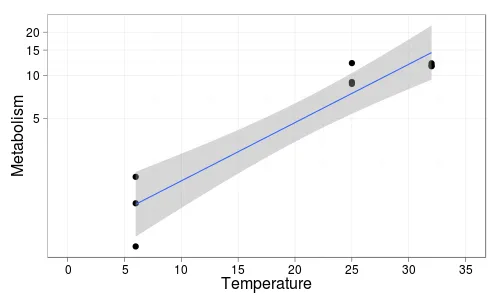
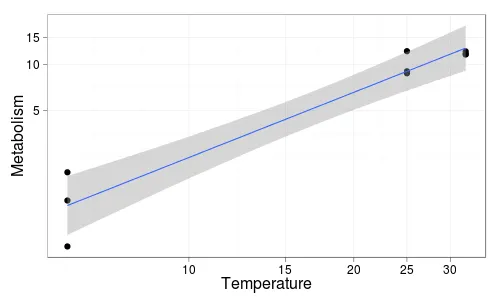
我有类似于这样的东西(只是数据更多):
require(ggplot2)

df <-read.table("test.csv", header = TRUE, sep = ",")
df
    meta temp
1  1.283    6
2  0.642    6
3  1.962    6
4  8.989   25
5  8.721   25
6 12.175   25
7 11.676   32
8 12.131   32
9 11.576   32

ggplot(df, aes(temp, meta)) + 
    ylab("Metabolism") + xlab("Temperature") +
    geom_point() + 
    theme_bw() + 
    scale_x_continuous(limits = c(0, 35)) + 
    scale_y_log10()

我知道这应该用指数函数来表示,所以我的问题是如何添加最佳的“指数”拟合?同样,是否可能进行幂拟合?

stat_smooth() 函数有这个机会吗?或者我应该使用 ggplot2 包中的其他函数?


1
欢迎来到SO。感谢您发布代码和示例数据,给您点赞。 - Andrie
1个回答

10

您可以通过传递两个参数来指定要拟合的模型作为 stat_smooth 的参数:

  • 方法,例如 method="lm"
  • 模型,例如 model = log(y) ~ x

ggplot2 首先进行比例尺转换,然后拟合模型,所以在您的示例中,您只需要添加

+ stat_smooth(method="lm")

添加到您的图表:

library(ggplot2)
ggplot(df, aes(temp, meta)) + 
    ylab("Metabolism") + xlab("Temperature") +
    geom_point() + 
    theme_bw() + 
    scale_x_continuous(limits = c(0, 35)) + 
    scale_y_log10() +
    stat_smooth(method="lm")

enter image description here


同样地,拟合和绘制幂函数曲线只需将x轴刻度改为对数刻度即可。
ggplot(df, aes(temp, meta)) + 
    ylab("Metabolism") + xlab("Temperature") +
    geom_point() + 
    theme_bw() + 
    scale_x_log10() + 
    scale_y_log10() +
    stat_smooth(method="lm")

enter image description here


非常感谢!很棒的是,当轴改变时,ggplot可以自行确定使用哪种模型。不过我还有一个问题。是否可以从拟合中获取R^2值?在普通线性图中,我只需使用:fit <- lm(x~y, data=df), summary(fit)[C("r.squire")] - PJensen

网页内容由stack overflow 提供, 点击上面的
可以查看英文原文,
原文链接