给 ggplot 添加自定义图例

3
我制作了一个散点图并添加了回归线。在
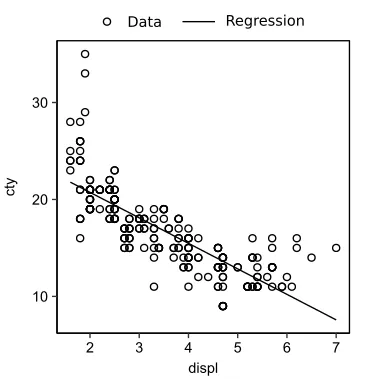
ggplot2中我是新手,不太明白如何添加图例。我想要一个像散点图一样的圆圈,标注为“数据”,还有一条标注为“回归”的线。我该怎么做?
library(ggplot2)

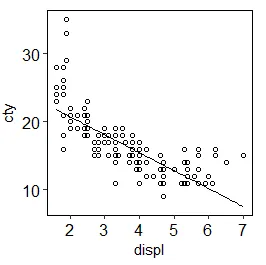
ggplot(mpg, aes(displ, cty)) + geom_point(shape = 1) +
  stat_smooth(method = "lm", formula = y ~ x, se = FALSE, colour = 1, size = 0.5) +
  theme_classic() + theme(panel.border = element_rect(colour = "black", fill=NA),
                          aspect.ratio = 1, axis.text = element_text(colour = 1, size = 12))

enter image description here

我想要类似这样的东西:

enter image description here


https://dev59.com/p2kv5IYBdhLWcg3wxzyA - Mitch Wheat
https://www.google.com.au/search?q=ggplot+add+a+legend - Mitch Wheat
1个回答

2

ggplot 中实现自定义图例可能会有些棘手,因为该系统主要基于将数据映射到尺度上,然后使用该尺度来创建图例。对于自定义图例,您可以使用一个 aes() 调用,手动设置您想要的图例标签,如下所示:

ggplot(mpg, aes(displ, cty)) + 
    geom_point(aes(shape = "Data")) +
    stat_smooth(aes(linetype = "Regression"), method = "lm", 
                formula = y ~ x, se = FALSE, colour = 1, size = 0.5) +
    scale_shape_manual(values = 1) +
    labs(shape = "", linetype = "") +
    theme_classic() + 
    theme(panel.border = element_rect(colour = "black", fill=NA),
          aspect.ratio = 1, axis.text = element_text(colour = 1, size = 12))

网页内容由stack overflow 提供, 点击上面的
可以查看英文原文,
原文链接