给绘图添加图例

3
如何在位于绘图区域外的以下代码中添加图例。 这是可复制的代码:
par(pty="s")
library(ROCR)
data(ROCR.simple)
pred <- prediction( ROCR.simple$predictions, ROCR.simple$labels )
pred2 <- prediction(abs(ROCR.simple$predictions + 
                    rnorm(length(ROCR.simple$predictions), 0, 0.1)), 
            ROCR.simple$labels)
perf <- performance(pred, "tpr", "fpr" )
perf2 <- performance(pred2, "tpr", "fpr")
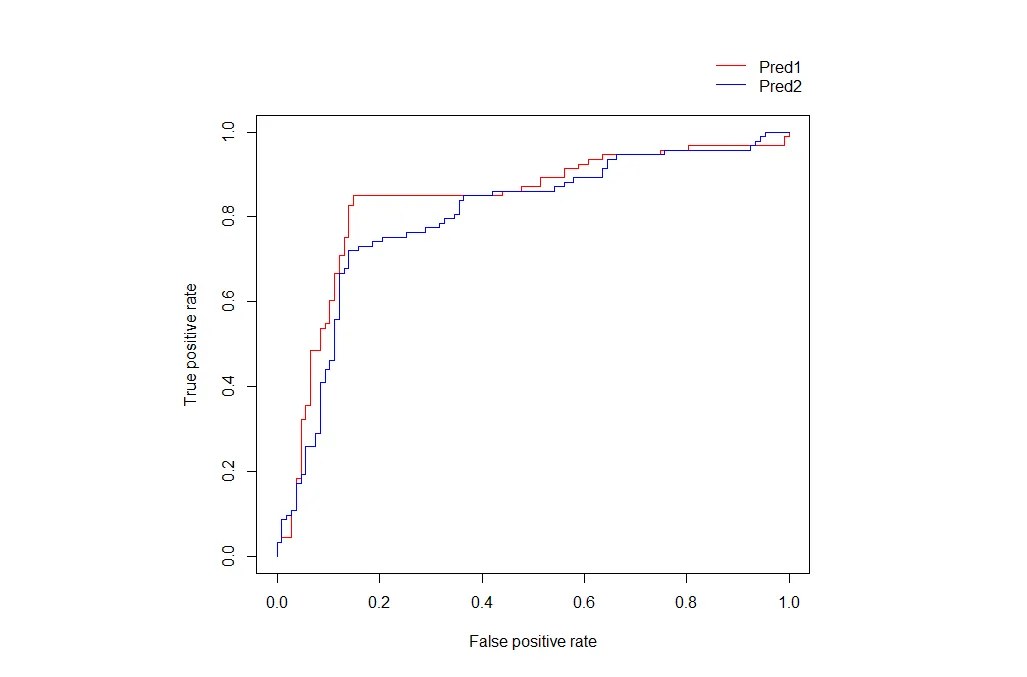
# Plot pred 1
plot(perf, col="red")
# plot pred 2
plot(perf2, add = TRUE, col="blue")

任何建议都将不胜感激。谢谢!

为什么图例应该放在绘图区域之外?右下方有一个很大的空白区域。 - G5W
由于每次运行代码时情节都会改变,原始代码有时会在低水平处出现曲线。 - Joe
1个回答

4

您可以使用par来增加顶部的边距,并启用在绘图区域之外编写。然后,您可以使用带有负insetlegend

## Your graph
par(mar=c(5.1,4.1,6,2.1), xpd=TRUE)
plot(perf, col="red")
plot(perf2, add = TRUE, col="blue")

## Add Legend
legend("topright", c("Pred1", "Pred2"), lty=1, 
    col = c("red", "blue"), bty="n", inset=c(0,-0.15))

Legend in margin


网页内容由stack overflow 提供, 点击上面的
可以查看英文原文,
原文链接