如何在Bokeh的步进图示例中为线条添加图例:
示例的默认代码如下:
https://docs.bokeh.org/en/latest/docs/reference/models/glyphs/step.html
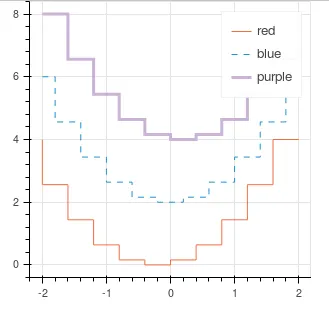
我希望每条线的图例以线条颜色和样式为基础,显示在绘图区域的“右上角”位置。示例的默认代码如下:
import numpy as np


from bokeh.models import ColumnDataSource, DataRange1d, Plot, LinearAxis, Grid

from bokeh.models.glyphs import Step

from bokeh.io import curdoc, show


N = 11

x = np.linspace(-2, 2, N)
y = x**2

source = ColumnDataSource(dict(x=x, y1=y, y2=y+2, y3=y+4))

xdr = DataRange1d()
ydr = DataRange1d()

plot = Plot(
    title=None, x_range=xdr, y_range=ydr, plot_width=300, plot_height=300,
    h_symmetry=False, v_symmetry=False, min_border=0,toolbar_location=None)

glyph1 = Step(x="x", y="y1", line_color="#f46d43", mode="before")
plot.add_glyph(source, glyph1)

glyph2 = Step(x="x", y="y2", line_dash="dashed", line_color="#1d91d0", mode="center")
plot.add_glyph(source, glyph2)

glyph3 = Step(x="x", y="y3", line_width=3, line_color="#cab2d6", mode="after")
plot.add_glyph(source, glyph3)

xaxis = LinearAxis()
plot.add_layout(xaxis, 'below')

yaxis = LinearAxis()
plot.add_layout(yaxis, 'left')

plot.add_layout(Grid(dimension=0, ticker=xaxis.ticker))
plot.add_layout(Grid(dimension=1, ticker=yaxis.ticker))

curdoc().add_root(plot)

show(plot)