给表面图添加图例

15

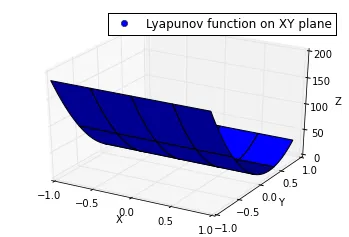
我正在尝试给一个曲面图添加图例,但无法实现。以下是代码。

import numpy as np
from mpl_toolkits.mplot3d import Axes3D
import matplotlib.pyplot as plt
import random

def fun(x, y):
  return 0.063*x**2 + 0.0628*x*y - 0.15015876*x + 96.1659*y**2 - 74.05284306*y  +      14.319143466051


fig = plt.figure()
ax = fig.add_subplot(111, projection='3d')
x = y = np.arange(-1.0, 1.0, 0.05)
X, Y = np.meshgrid(x, y)
zs = np.array([fun(x,y) for x,y in zip(np.ravel(X), np.ravel(Y))])
Z = zs.reshape(X.shape)

ax.plot_surface(X, Y, Z)

ax.set_xlabel('X')
ax.set_ylabel('Y')
ax.set_zlabel('Z')
plt.plot(color='red',label='Lyapunov function on XY plane',linewidth=4)  # Adding legend

plt.show()

请帮忙,谢谢您的帮助。


当你说“我无法这样做”时,你是什么意思?你遇到了错误吗?还是只是不确定该怎么做? - gcarvelli
我尝试包含图例的方式并没有给出正确的答案。所以,是的,我不知道该怎么做。 - Chikorita Rai
matplotlib 在这里提供了一个非常棒的自定义图例教程,链接在此:http://matplotlib.org/users/legend_guide.html。其中有许多代码示例可以帮助你编写自己的图例。 - gcarvelli
2个回答

19

在 3D 坐标轴中制作图例并非易事。您可以使用以下技巧:

import numpy as np
from mpl_toolkits.mplot3d import Axes3D
import matplotlib.pyplot as plt
import matplotlib as mpl
import random

def fun(x, y):
  return 0.063*x**2 + 0.0628*x*y - 0.15015876*x + 96.1659*y**2 - 74.05284306*y  +      14.319143466051


fig = plt.figure()
ax = fig.add_subplot(111, projection='3d')
x = y = np.arange(-1.0, 1.0, 0.05)
X, Y = np.meshgrid(x, y)
zs = np.array([fun(x,y) for x,y in zip(np.ravel(X), np.ravel(Y))])
Z = zs.reshape(X.shape)

ax.plot_surface(X, Y, Z)

ax.set_xlabel('X')
ax.set_ylabel('Y')
ax.set_zlabel('Z')
fake2Dline = mpl.lines.Line2D([0],[0], linestyle="none", c='b', marker = 'o')
ax.legend([fake2Dline], ['Lyapunov function on XY plane'], numpoints = 1)
plt.show()

enter image description here

在这种情况下,我会说使用标题比使用图例更恰当。


1
为什么需要 fake2Dline = mpl.lines.Line2D([0],[0], linestyle="none", c='b', marker = 'o') 才能使它工作? - Charlie Parker
你介意解释一下你的代码在做什么以及为什么解决方案是这样的吗?对我来说毫无意义,如果没有一些关于理论基础的解释,很难将其适应到我的代码中。 - Charlie Parker
另外,你的指示似乎有些问题,因为我的Surface的颜色与你的“fake2Dline”不匹配,它有自己独立的颜色。 - Charlie Parker
对于那些寻求解释的人,他在图中添加了一条虚假的线,并将该线的图例添加到图中,而不是表面的图例。 - alok.m

5
根据这个问题,该问题仍在进行中,并且存在一个相对简单的解决方法。您可以手动设置两个缺失的属性,这将允许legend自动为您创建补丁。
surf = ax.plot_surface(X, Y, Z, label='Lyapunov function on XY plane')
surf._edgecolors2d = surf._edgecolor3d
surf._facecolors2d = surf._facecolor3d

ax.legend()

在matplotlib < v3.3.3中,赋值右侧的属性名称分别为 surf._edgecolors3dsurf.facecolors3d

网页内容由stack overflow 提供, 点击上面的
可以查看英文原文,
原文链接