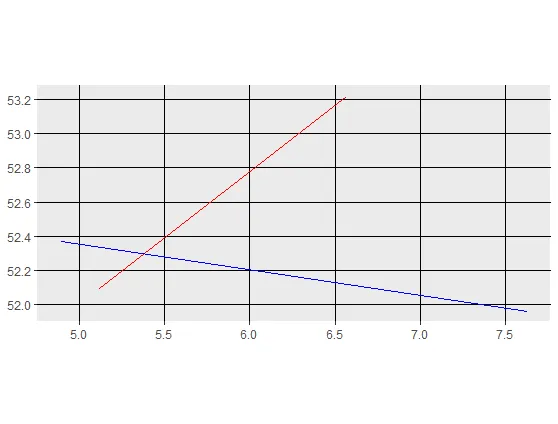
我有几个包含不同公共交通路线的空间形状文件,希望使用ggplot2和sf库制作地图。问题在于我手动为一些特定路线分配颜色,但是我无法将图例添加到图表中。
有没有想法如何使用geom_sf实现?
可重现的示例
library(sf)
library(ggplot2)

# reproducible data
  lon<-c(5.121420, 6.566502, 4.895168, 7.626135)
  lat<-c(52.09074, 53.21938, 52.37022, 51.96066)
  cities<-c('utrecht','groningen','amsterdam','munster')
  size<-c(300,500,1000,50)

  xy.cities<-data.frame(lon,lat,cities,size)

  # line example
  line1 <- st_linestring(as.matrix(xy.cities[1:2,1:2]))
  line2 <- st_linestring(as.matrix(xy.cities[3:4,1:2]))

  lines.sfc <- st_sfc(list(line1,line2))
  simple.lines.sf <- st_sf(id=1:2,size=c(10,50),geometry=lines.sfc)

# plot
  ggplot() +
    geom_sf(data= subset(simple.lines.sf, id==1), color="red" ) +
    geom_sf(data= subset(simple.lines.sf, id==2), color="blue" )
我知道可以做类似这样的事情:
代码示例:
  ggplot() +
    geom_sf(data= subset(simple.lines.sf, id>0), aes(color=factor(id)) ) +
    scale_color_manual(values=c("red", "blue"),
                       labels=c("route 1", "route 2"))
然而,我需要使用多个geom_sf来处理多个形状文件。此外,我希望图例显示为一条线的形式,而不是一个多边形的图例。

