多个geom_sf图例的格式化

10

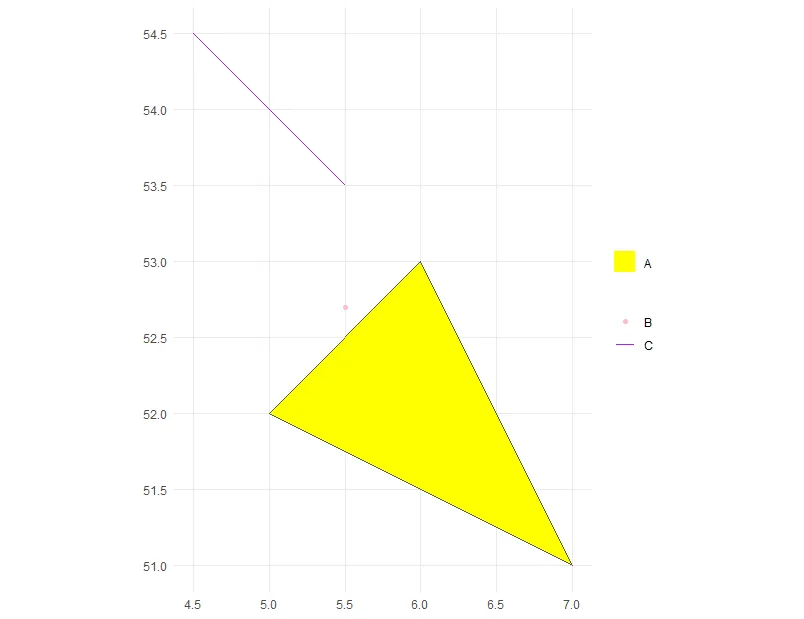
我正在处理多个sf几何图形,希望以点、线和正方形(用于多边形)的形式显示图例。然而,geom_sf图例将我的几何特征组合在一起(即组合线和点),如下所示:

library(ggplot2)
library(sf)

poly1 <- cbind(lon = c(5, 6, 7, 5), lat = c(52, 53, 51, 52))

poly <- st_sf(st_sfc(st_polygon(list(poly1))))
line <- st_sf(st_sfc(list(st_linestring(cbind(lon = c(5.5, 4.5), lat = c(53.5, 54.5))))))
point <- st_sf(st_sfc(st_point(cbind(lon = 5.5, lat = 52.7))))

ggplot() +
  geom_sf(data = poly, aes(fill = "A")) +
  geom_sf(data = point, aes(colour = "B"), show.legend = "point") +
  geom_sf(data = line, aes(colour = "C"), show.legend = "line") +
  scale_fill_manual(values = c("A" = "yellow")) +
  scale_colour_manual(values = c("B" = "pink", "C" = "purple")) +
  theme_minimal()

enter image description here

我希望在下面的图像上获得三个单独的图例,一个黄色正方形,一个粉色点和一条紫色线。当我绘制单独的几何图形时才会出现这种情况,而不是三者的组合。

enter image description here

enter image description here

enter image description here

我查阅了类似的主题,但没有涉及点几何,即https://github.com/tidyverse/ggplot2/issues/2460

有人能提供任何见解吗?

GitHub问题:https://github.com/tidyverse/ggplot2/issues/2763

2个回答

12
受 @Axeman 评论启发,解决了这个问题。详情请见 此问题此帖子。使用 guide_legend() 中的 override.aes 参数即可解决问题。
library(ggplot2)
library(sf)

poly1 <- cbind(lon = c(5, 6, 7, 5), lat = c(52, 53, 51, 52))

poly <- st_sf(st_sfc(st_polygon(list(poly1))))
line <- st_sf(st_sfc(list(st_linestring(cbind(lon = c(5.5, 4.5), lat = c(53.5, 54.5))))))
point <- st_sf(st_sfc(st_point(cbind(lon = 5.5, lat = 52.7))))

ggplot() +
  geom_sf(data = poly, aes(fill = "A")) +
  geom_sf(data = point, aes(colour = "B"), show.legend = "point") +
  geom_sf(data = line, aes(colour = "C"), show.legend = "line") +
  scale_fill_manual(values = c("A" = "yellow"), name = NULL,
                    guide = guide_legend(override.aes = list(linetype = "blank", shape = NA))) +
  scale_colour_manual(values = c("B" = "pink", "C" = "purple"), name = NULL,
                      guide = guide_legend(override.aes = list(linetype = c("blank", "solid"), 
                                                               shape = c(16, NA)))) +
  theme_minimal() 

输入图像描述


4

我知道如何分离图例,现在它们只会组合在一起是因为您将颜色映射两次。通过将形状映射到点并设置颜色,您可以避免这种情况:

ggplot() +
  geom_sf(data = poly, aes(fill = "A")) +
  geom_sf(data = point, aes(colour = "B"), show.legend = "point") +
  geom_sf(data = line, aes(shape = "C"), show.legend = "line", color = 'purple') +
  scale_fill_manual(name = NULL, values = c("A" = "yellow")) +
  scale_colour_manual(name = NULL, values = c("B" = "pink")) +
  scale_shape_discrete(
    name = NULL, 
    guide = guide_legend(override.aes = list(color = 'purple'))) +
  theme_minimal()

enter image description here

但是:在所有三个图例中仍然显示了点和线。我认为它们不应该出现!也许你可以提交一个 Github 问题。


谢谢你的回答 - 我会提交一个问题。 - Jane
我已经发布了另一个答案。感谢您的评论! - Jane

网页内容由stack overflow 提供, 点击上面的
可以查看英文原文,
原文链接