在ggplot2中绘制两个位置之间的曲线

4

我正在制作一张关于从美洲向荷兰出口的地图。为了展示我的数据,我想做一张由美洲国家到荷兰的箭头地图。我使用cshapes世界地图和ggplot2。

data = data.frame("Country.name" = c("Brazil","USA","Canada","Paraguay","Uruguay"), "lng" =    
c(14.23,37,56.13,-23.44,-32.52), "lat" = c(-51.92,-95.71,-106.34,-58.44,-55.77))

require(cshapes)
cshp.data = cshp(date=as.Date("2012-1-1"), useGW=TRUE)
region.data.frame = fortify(cshp.data, region = "ISO1AL3")

ggplot(region.data.frame) + geom_polygon(aes(long,lat,group=group)) +
geom_segment(data = data, aes(x = lat, y = lng, xend= (5.29 - 0.1 * (5.29 - lat)), yend= (52.13 - 0.1 * (52.13 - lng))),
arrow=arrow(length=unit(0.5,"cm"), angle = 45, type = "closed"))

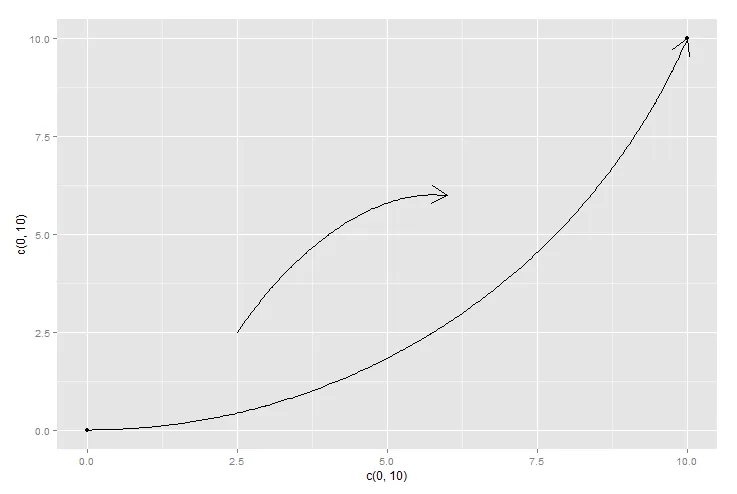
我发现直接绘制的线相互重叠,这很丑陋。因此,我正在寻找一种在ggplot2中绘制曲线连接坐标的方法,这样它们就不会重叠。


1
也许大圆路径可能是一个选择?您可以查看geosphere包 - Henrik
1
这可能会有用:https://dev59.com/W3bZa4cB1Zd3GeqPJL7Z - Tyler Rinker
1个回答

9

由于某些原因,我无法运行 cshapes,但是以下是使用 grid 包中的 curveGrob()ggplot2annotation_custom() 函数构建曲线的示例。它可以给予您很高的灵活性。PS:大多数参数只是默认值。编辑 - 更新以显示 2 条曲线。

require(grid)
g<-qplot(c(0,10),c(0,10))
myCurve<-curveGrob(0, 0, 1, 1, default.units = "npc",
               curvature = 0.3, angle = 90, ncp = 20, shape = 1,
               square = FALSE, squareShape = 1,
               inflect = FALSE, arrow = arrow(), open = TRUE,
               debug = FALSE,
               name = NULL, gp = gpar(), vp = NULL)

myCurve2<-curveGrob(0, 0, 1, 1, default.units = "npc",
               curvature = -0.3, angle = 60, ncp = 10, shape = 1,
               square = FALSE, squareShape = 1,
               inflect = FALSE, arrow = arrow(), open = TRUE,
               debug = FALSE,
               name = NULL, gp = gpar(), vp = NULL)

g + 
  annotation_custom(grob=myCurve,0,10,0,10) + # plot from 0,0 to 10,10
  annotation_custom(grob=myCurve2,2.5,6,2.5,6)   # plot from 2.5,2.5 to 6,6

#REFERENCE>>http://stat.ethz.ch/R-manual/R-devel/library/grid/html/grid.curve.html

enter image description here


网页内容由stack overflow 提供, 点击上面的
可以查看英文原文,
原文链接