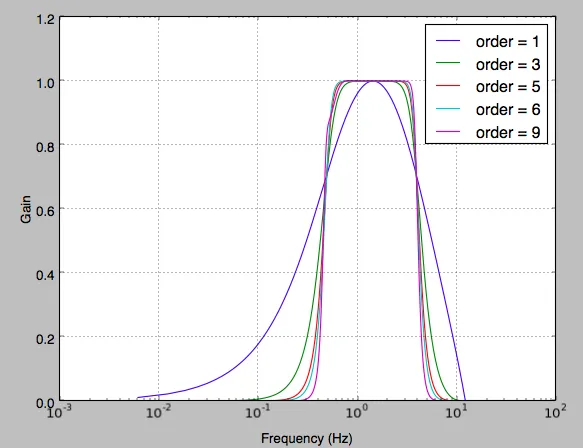
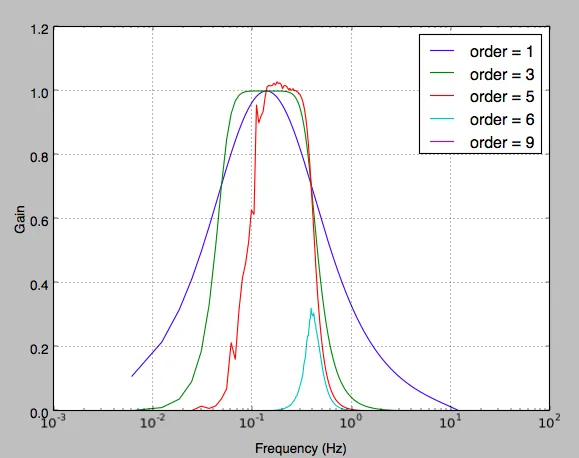
我正在使用scipy设计带通滤波器,参考了cookbook。然而,如果我将滤波频率减小太多,高阶滤波器会出现垃圾值。我做错了什么?
from scipy.signal import butter, lfilter

def butter_bandpass(lowcut, highcut, fs, order=5):
    nyq = 0.5 * fs
    low = lowcut / nyq
    high = highcut / nyq
    b, a = butter(order, [low, high], btype='band')
    return b, a

if __name__ == "__main__":
    import numpy as np
    import matplotlib.pyplot as plt
    from scipy.signal import freqz
    # Sample rate and desired cutoff frequencies (in Hz).
    fs = 25
    # Plot the frequency response for a few different orders.
    plt.figure(1)
    plt.clf()
    for order in [1, 3, 5, 6, 9]:
        b, a = butter_bandpass(0.5, 4, fs, order=order)
        w, h = freqz(b, a, worN=2000)#np.logspace(-4, 3, 2000))
        plt.semilogx((fs * 0.5 / np.pi) * w, abs(h), label="order = %d" % order)
    plt.xlabel('Frequency (Hz)')
    plt.ylabel('Gain')
    plt.grid(True)
    plt.legend(loc='best')

    plt.figure(2)
    plt.clf()
    for order in [1, 3, 5, 6, 9]:
        b, a = butter_bandpass(0.05, 0.4, fs, order=order)
        w, h = freqz(b, a, worN=2000)#np.logspace(-4, 3, 2000))
        plt.semilogx((fs * 0.5 / np.pi) * w, abs(h), label="order = %d" % order)
    plt.xlabel('Frequency (Hz)')
    plt.ylabel('Gain')
    plt.grid(True)
    plt.legend(loc='best')

    plt.show()
更新:该问题已经在 Scipy 0.14 上得到讨论和解决。然而,Scipy 更新后绘图仍然看起来非常糟糕。出了什么问题?
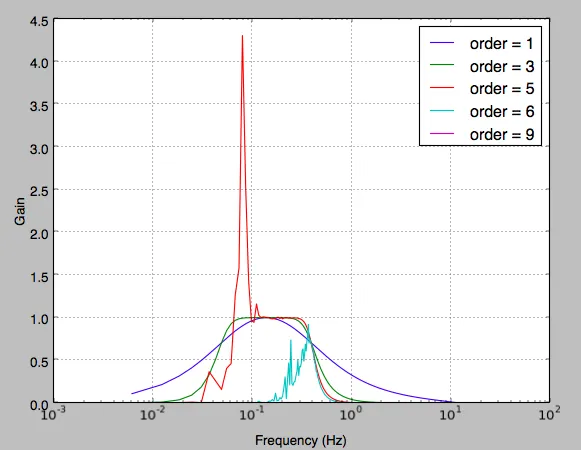
freqz和lfilter都需要a、b输入,而不是z、p、k,所以问题是:我该如何使用z、p、k来过滤信号? - Frafreqz以处理高阶滤波器。我认为没有办法使用它。关于过滤和绘制频率响应(和freqz相同的东西),请查看我在链接中发布的butter_sos_example.py。 - endolith