你可以使用函数
scipy.signal.firwin或
scipy.signal.firwin2来创建带通FIR滤波器。你也可以使用
scipy.signal.remez来设计一个FIR滤波器。
以下代码提供了一些方便的包装器,用于创建带通FIR滤波器。它使用这些包装器来创建与问题中所请求的数字相对应的带通滤波器。这假设采样是均匀的。如果采样不均匀,则不适合使用FIR滤波器。
from scipy.signal import firwin, remez, kaiser_atten, kaiser_beta
def bandpass_firwin(ntaps, lowcut, highcut, fs, window='hamming'):
taps = firwin(ntaps, [lowcut, highcut], fs=fs, pass_zero=False,
window=window, scale=False)
return taps
def bandpass_kaiser(ntaps, lowcut, highcut, fs, width):
atten = kaiser_atten(ntaps, width/(0.5*fs))
beta = kaiser_beta(atten)
taps = firwin(ntaps, [lowcut, highcut], fs=fs, pass_zero=False,
window=('kaiser', beta), scale=False)
return taps
def bandpass_remez(ntaps, lowcut, highcut, fs, width):
delta = 0.5 * width
edges = [0, lowcut - delta, lowcut + delta,
highcut - delta, highcut + delta, 0.5*fs]
taps = remez(ntaps, edges, [0, 1, 0], fs=fs)
return taps
if __name__ == "__main__":
import matplotlib.pyplot as plt
from scipy.signal import freqz
fs = 63.0
lowcut = 0.7
highcut = 4.0
ntaps = 128
taps_hamming = bandpass_firwin(ntaps, lowcut, highcut, fs=fs)
taps_kaiser16 = bandpass_kaiser(ntaps, lowcut, highcut, fs=fs, width=1.6)
taps_kaiser10 = bandpass_kaiser(ntaps, lowcut, highcut, fs=fs, width=1.0)
remez_width = 1.0
taps_remez = bandpass_remez(ntaps, lowcut, highcut, fs=fs,
width=remez_width)
plt.figure(1, figsize=(12, 9))
plt.clf()
rect = plt.Rectangle((lowcut, 0), highcut - lowcut, 1.0,
facecolor="#60ff60", alpha=0.2)
plt.gca().add_patch(rect)
w, h = freqz(taps_hamming, 1, worN=2000, fs=fs)
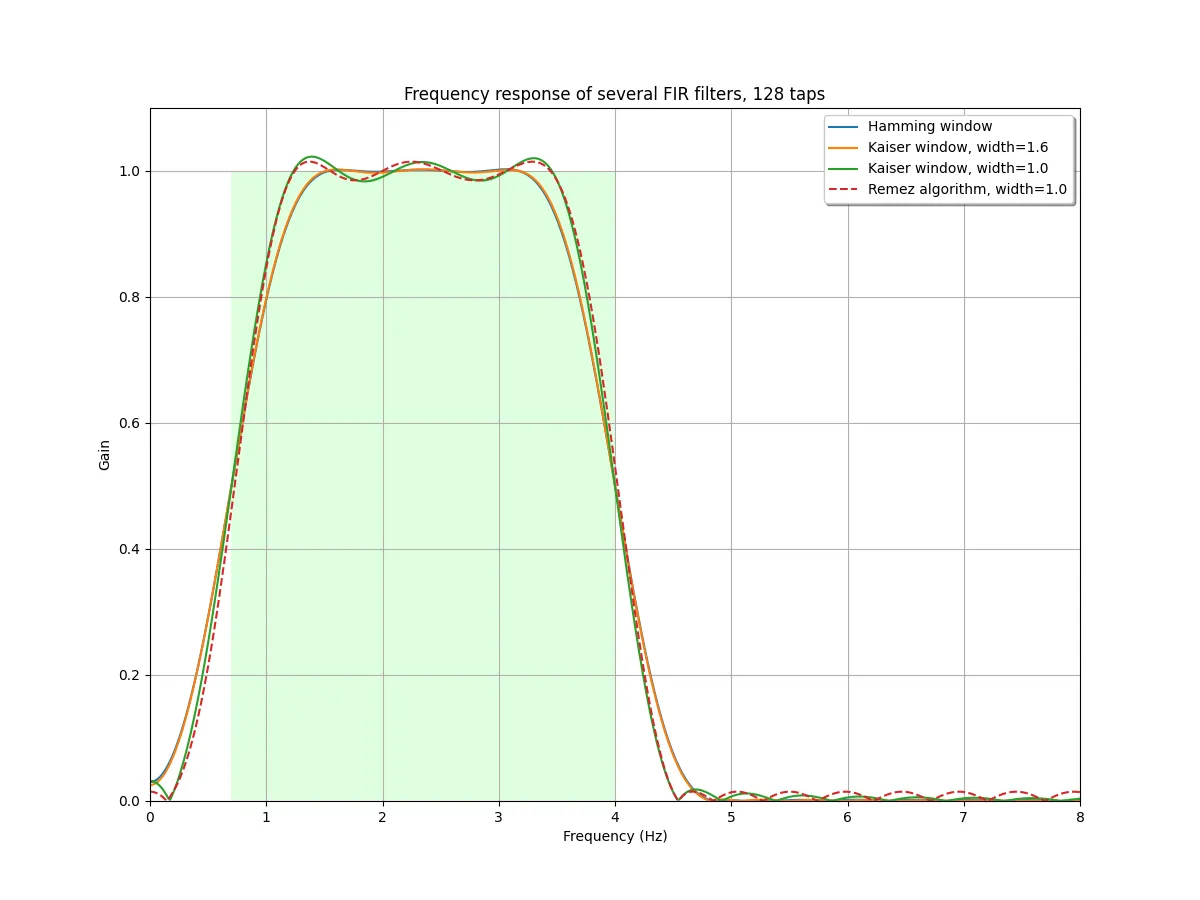
plt.plot(w, abs(h), label="Hamming window")
w, h = freqz(taps_kaiser16, 1, worN=2000, fs=fs)
plt.plot(w, abs(h), label="Kaiser window, width=1.6")
w, h = freqz(taps_kaiser10, 1, worN=2000, fs=fs)
plt.plot(w, abs(h), label="Kaiser window, width=1.0")
w, h = freqz(taps_remez, 1, worN=2000, fs=fs)
plt.plot(w, abs(h), '--',
label="Remez algorithm, width=%.1f" % remez_width)
plt.xlim(0, 8.0)
plt.ylim(0, 1.1)
plt.grid(True)
plt.legend(shadow=True, framealpha=1)
plt.xlabel('Frequency (Hz)')
plt.ylabel('Gain')
plt.title('Frequency response of several FIR filters, %d taps' % ntaps)
plt.show()
这是脚本生成的情节。当然,最好在本地运行脚本,这样你可以放大细节。