如何在Python中使用Scipy创建一个带通滤波器?

4

有没有一种方法可以使用Python 3.6中的scipylibrosa快速创建一个带通滤波器,以过滤300-3400Hz人声频带之外的噪音?这里有一个示例wav文件,其中包含低频背景噪声。

更新: 是的,我已经看到/尝试过如何使用Scipy.signal.butter实现带通Butterworth滤波器。不幸的是,过滤后的声音非常失真。基本上,整个代码做了这件事:

lo,hi=300,3400
sr,y=wavfile.read(wav_file)
b,a=butter(N=6, Wn=[2*lo/sr, 2*hi/sr], btype='band')
x = lfilter(b,a,y)
sounddevice.play(x, sr)  # playback

我做错了什么或者如何改进,使得背景噪声能够正确过滤掉。

使用上述链接,这是原始文件和过滤后文件的可视化效果。虽然可视化看起来还不错,但听起来很糟糕 :( 怎样才能解决这个问题?

enter image description here


请参见 https://dev59.com/O2ct5IYBdhLWcg3wcs-G,了解如何使用Scipy Signal Butter实现带通Butterworth滤波器。 - Warren Weckesser
2个回答

4
显然,当写入未规范化的64位浮点数据时会出现问题。通过将x转换为16位或32位整数,或将x规范化到[-1,1]范围内并转换为32位浮点数,可以得到一个合理的输出文件。
我没有使用sounddevice;相反,我将过滤后的数据保存到新的WAV文件中并播放它。以下是对我有效的变化:
# Convert to 16 integers
wavfile.write('off_plus_noise_filtered.wav', sr, x.astype(np.int16))

or...

# Convert to 32 bit integers
wavfile.write('off_plus_noise_filtered.wav', sr, x.astype(np.int32))

或者...

# Convert to normalized 32 bit floating point
normalized_x = x / np.abs(x).max()
wavfile.write('off_plus_noise_filtered.wav', sr, normalized_x.astype(np.float32))

当输出整数时,您可以将值放大以减少截断浮点值导致的精度损失:

x16 = (normalized_x * (2**15-1)).astype(np.int16)
wavfile.write('off_plus_noise_filtered.wav', sr, x16)

谢谢你,沃伦。规范化有所帮助!有没有一些理论内容可以阅读关于规范化的影响?它所做的只是通过一个常量重新调整波形。为什么声音质量会发生如此剧烈的变化?这是否与扬声器的传递能力有关? - Oleg Melnikov
我认为 WAV 规范的一部分是浮点数据应该限制在 [-1, 1] 的范围内。可以推断 sounddevice.play() 也有同样的期望。如果超出这些限制,你会使你的声音系统饱和,并且如果音量足够高,你可能会损坏扬声器或耳膜。(当我播放未归一化数据的 WAV 文件时,我的情况非常接近!) - Warren Weckesser
经过一番调查,我发现了同样的问题。似乎是在播放之前将大量非规范化的数值剪裁,从而产生了我所注意到的可怕声音。非常感谢。 - Oleg Melnikov

3
以下代码用于从此处生成带通滤波器:https://scipy.github.io/old-wiki/pages/Cookbook/ButterworthBandpass
     from scipy.signal import butter, lfilter


def butter_bandpass(lowcut, highcut, fs, order=5):
    nyq = 0.5 * fs
    low = lowcut / nyq
    high = highcut / nyq
    b, a = butter(order, [low, high], btype='band')
    return b, a


def butter_bandpass_filter(data, lowcut, highcut, fs, order=5):
    b, a = butter_bandpass(lowcut, highcut, fs, order=order)
    y = lfilter(b, a, data)
    return y


if __name__ == "__main__":
    import numpy as np
    import matplotlib.pyplot as plt
    from scipy.signal import freqz

    # Sample rate and desired cutoff frequencies (in Hz).
    fs = 5000.0
    lowcut = 500.0
    highcut = 1250.0

    # Plot the frequency response for a few different orders.
    plt.figure(1)
    plt.clf()
    for order in [3, 6, 9]:
        b, a = butter_bandpass(lowcut, highcut, fs, order=order)
        w, h = freqz(b, a, worN=2000)
        plt.plot((fs * 0.5 / np.pi) * w, abs(h), label="order = %d" % order)

    plt.plot([0, 0.5 * fs], [np.sqrt(0.5), np.sqrt(0.5)],
             '--', label='sqrt(0.5)')
    plt.xlabel('Frequency (Hz)')
    plt.ylabel('Gain')
    plt.grid(True)
    plt.legend(loc='best')

    # Filter a noisy signal.
    T = 0.05
    nsamples = T * fs
    t = np.linspace(0, T, nsamples, endpoint=False)
    a = 0.02
    f0 = 600.0
    x = 0.1 * np.sin(2 * np.pi * 1.2 * np.sqrt(t))
    x += 0.01 * np.cos(2 * np.pi * 312 * t + 0.1)
    x += a * np.cos(2 * np.pi * f0 * t + .11)
    x += 0.03 * np.cos(2 * np.pi * 2000 * t)
    plt.figure(2)
    plt.clf()
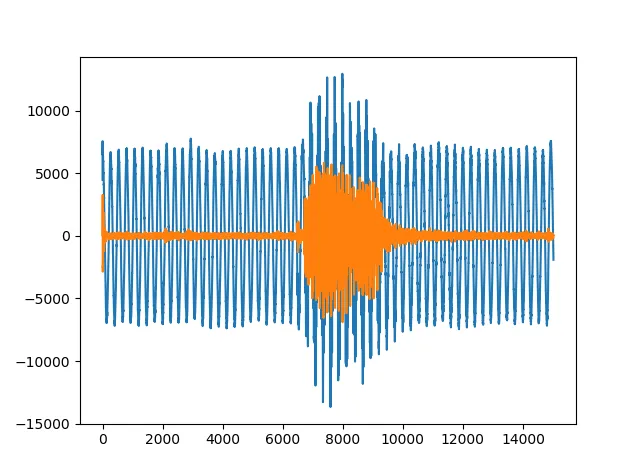
    plt.plot(t, x, label='Noisy signal')

    y = butter_bandpass_filter(x, lowcut, highcut, fs, order=6)
    plt.plot(t, y, label='Filtered signal (%g Hz)' % f0)
    plt.xlabel('time (seconds)')
    plt.hlines([-a, a], 0, T, linestyles='--')
    plt.grid(True)
    plt.axis('tight')
    plt.legend(loc='upper left')

    plt.show() 

看看这是否有助于您的事业。

您可以在此处指定所需的频率:

# Sample rate and desired cutoff frequencies (in Hz).
        fs = 5000.0
        lowcut = 500.0
        highcut = 1250.0

我之前尝试过这段代码,但它似乎不能正确地进行滤波。滤波后的声音非常失真。基本上,整个代码执行以下操作: hi=300.0; lo=3400.0; sr,y=wavfile.read(wav_file); b,a=butter(N=6, Wn=[2*lo/sr, 2*hi/sr], btype='band'); x = lfilter(b,a,y) - Oleg Melnikov

网页内容由stack overflow 提供, 点击上面的
可以查看英文原文,
原文链接