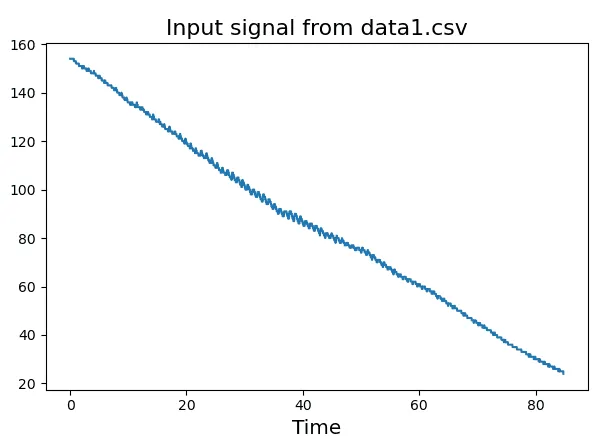
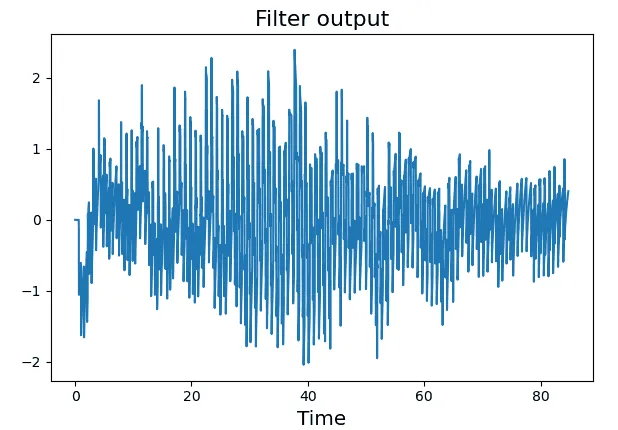
我想使用带通滤波器去趋势化一个信号。我在Python中使用了FL=0.1 Hz和FH=20 Hz的Butterworth滤波器,但在应用该带通滤波器后,我发现趋势化信号的开头出现了一个大的尖峰。
这个尖峰是什么原因造成的?如何在Python中去除这个尖峰?
您可以使用此链接下载"data1.csv"。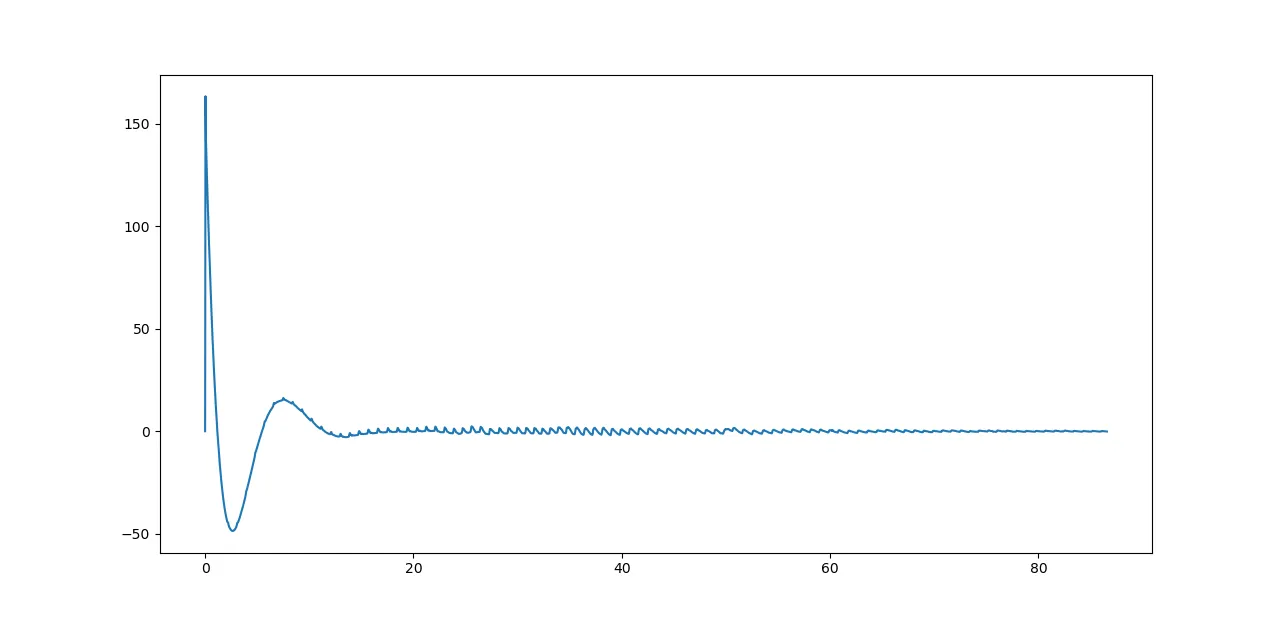
这个尖峰是什么原因造成的?如何在Python中去除这个尖峰?
您可以使用此链接下载"data1.csv"。
from scipy.signal import butter, lfilter
from numpy import genfromtxt
import numpy as np
import matplotlib.pyplot as plt

def butter_bandpass(lowcut, highcut, fs, order=5):
    nyq = 0.5 * fs
    low = lowcut / nyq
    high = highcut / nyq
    b, a = butter(order, [low, high], btype='band')
    return b, a

def butter_bandpass_filter(data, lowcut, highcut, fs, order=5):
    b, a = butter_bandpass(lowcut, highcut, fs, order=order)
    y = lfilter(b, a, data)
    return y


BP_without_NaN = genfromtxt('data1.csv', delimiter=',')
framerate=1024

# detrending [0.1Hz  20Hz]
OMW = butter_bandpass_filter(data = BP_without_NaN, lowcut = 0.1, highcut = 20 , fs = framerate, order = 3)

# plot OMW
time = np.linspace(0, len(OMW)/framerate ,len(OMW))
plt.plot(time, OMW)
plt.show()