Matplotlib表面绘图的三角剖分不直观

3

我有以下代码可以生成一个表面图,但它并没有达到我的预期。

xx, yy = np.meshgrid(dealer_sums, player_sums)
    def getter(dealer_sum, player_sum):
        state = (dealer_sum, player_sum)
        return self.get_value(state)
    z = np.vectorize(getter)
    zz = z(xx,yy)

    fig = plt.figure()
    ax  = fig.add_subplot(111, projection='3d')
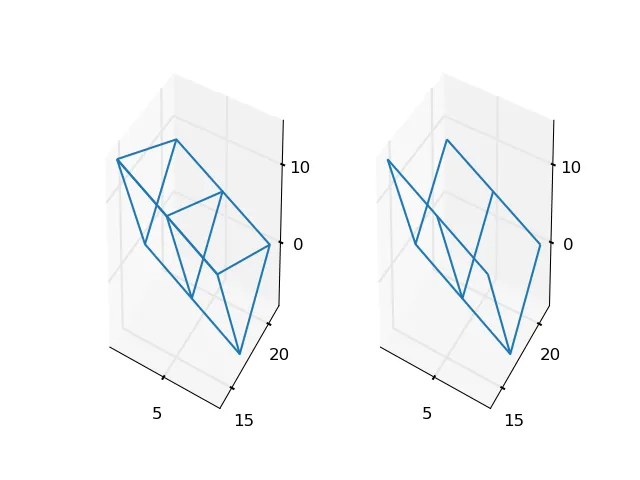
    ax.plot_wireframe(xx,yy, zz)

FYI,xx、yy和zz的形状都是相等的且为2D。
从查看其他帖子(surface plots in matplotlib;Simplest way to plot 3d surface given 3d points)来看,一个常见的问题是x和y坐标不规则,但如果我理解正确的话,我认为通过调用np.meshgrid函数已经将它们规范化了?
我提供了下面的散点图,以显示没有曲面时数据的样子: https://istack.dev59.com/ukvgb.webp 这就是对plot_wireframe函数的调用: https://istack.dev59.com/8zAYW.webp 我画了一些我没想到的线。我的问题是,是否有可能摆脱这些线,并创建一个看起来像这样的曲面? https://istack.dev59.com/PBG7C.webp 感谢您的帮助。
编辑:这是XY网格的散点图,显示它是规则的: https://istack.dev59.com/XiqRD.webp
1个回答

1
请确保在调用 meshgrid 之前对 dealer_sumsplayer_sums 进行排序,否则线框图中连接的点也会无序:
import numpy as np
import matplotlib.pyplot as plt
import mpl_toolkits.mplot3d.axes3d as axes3d

def z(xx, yy):
    return -xx + (yy-18)**2

dealer_sums = [1, 5, 9]
player_sums = [14, 17, 21, 14]

fig = plt.figure()
ax = fig.add_subplot(1, 2, 1, projection='3d')
ax2 = fig.add_subplot(1, 2, 2, projection='3d')

xx, yy = np.meshgrid(dealer_sums, player_sums)
zz = z(xx, yy)
ax.plot_wireframe(xx, yy, zz)

xx2, yy2 = np.meshgrid(np.unique(dealer_sums), np.unique(player_sums))
zz2 = z(xx2, yy2)

ax2.plot_wireframe(xx2, yy2, zz2)
plt.show()

enter image description here

左边是未排序的 dealer_sumsplayer_sums。 右边是已排序的。


np.unique 以排序的方式返回唯一值。在上面的代码中,最重要的是排序,但是没有必要使用重复的坐标创建网格,所以唯一性是一个附加的好处。


请注意,meshgrid 不一定返回一个规则网格。如果 dealer_sums 和/或 player_sums 不规则,则 xx 和/或 yy 也将不规则。
In [218]: xx, yy = np.meshgrid([0,2,1], [0, .5, 10])

In [219]: xx
Out[219]: 
array([[0, 2, 1],
       [0, 2, 1],
       [0, 2, 1]])

In [220]: yy
Out[220]: 
array([[  0. ,   0. ,   0. ],
       [  0.5,   0.5,   0.5],
       [ 10. ,  10. ,  10. ]])

网页内容由stack overflow 提供, 点击上面的
可以查看英文原文,
原文链接