我正在尝试绘制高分辨率的曲面图,但我也希望在其上有一些漂亮的网格线。如果我在相同的参数中使用网格线。
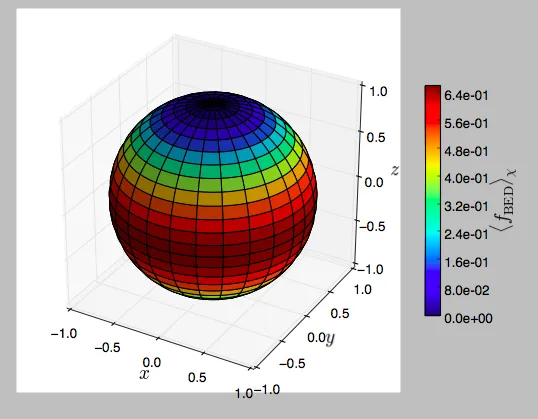
我得到了很多的网格线。另一方面,如果我将“rstride”和“cstride”设置为更高的值,我的球体会变得丑陋。
然后我试图压缩一个 (此处可能有遗漏或错误,请根据上下文理解)
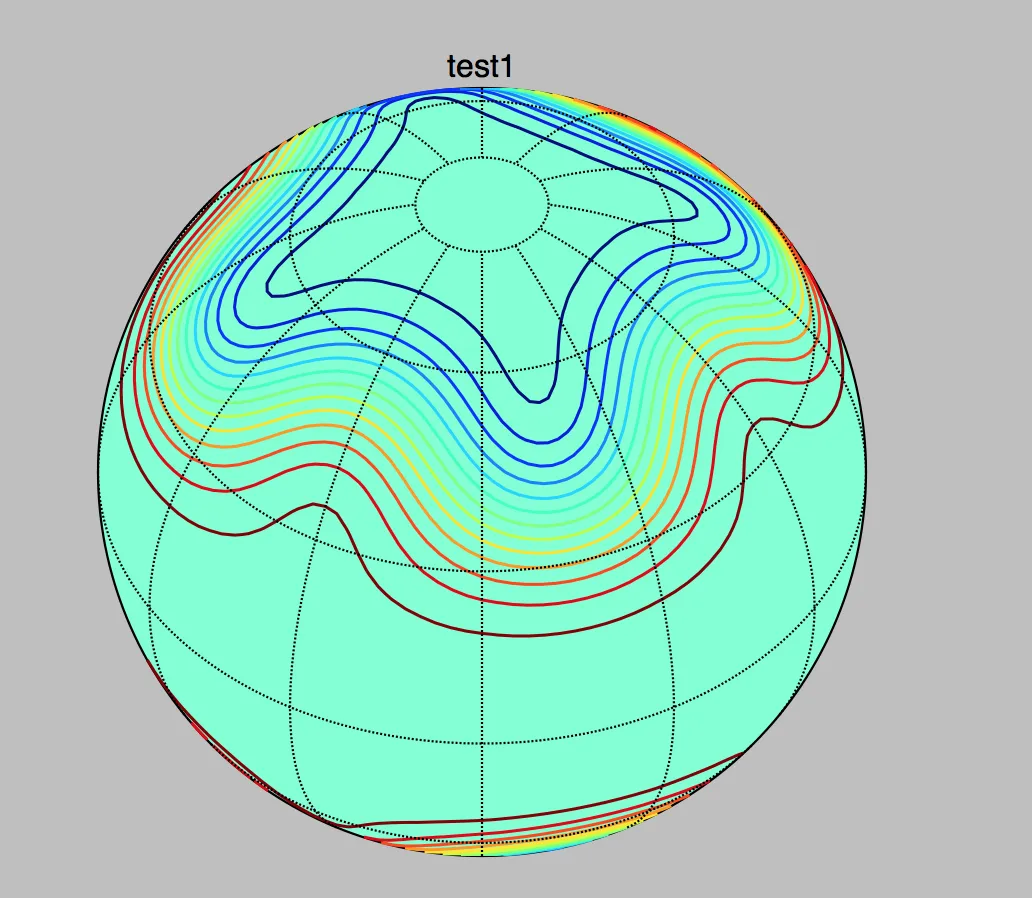
在后面,但它只是位于有色球体的顶部..这意味着我可以看到线框模型的背面,然后是所有背后的表面绘图。有人试过这个吗?另一个选择是使用"Basemap",它可以创建一个漂亮的网格,但是我将不得不适应那个彩色的表面吗?!我的图表看起来像这样: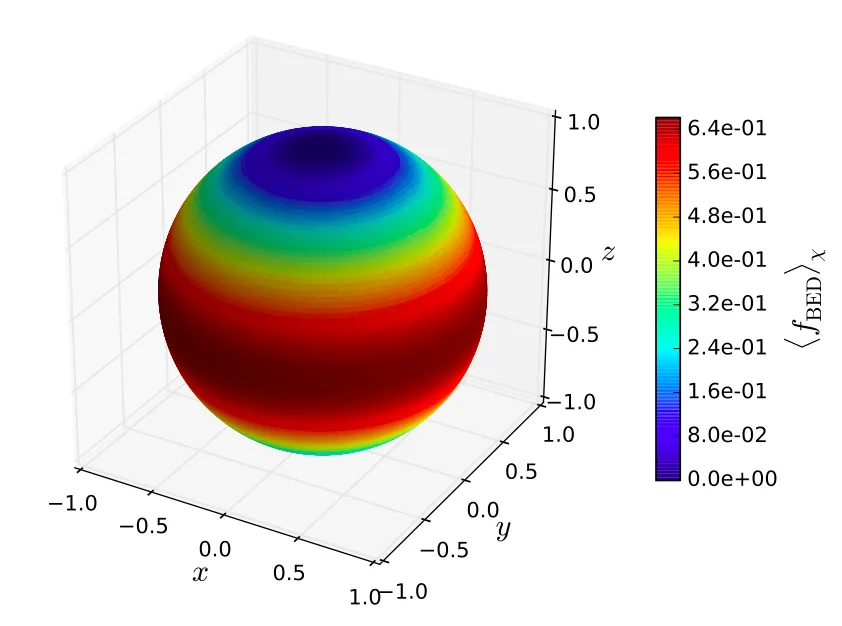 如果我用更高的"rstride"和"cstride"添加地图边缘,那么它看起来像这样:
我想展示球体周围的θ和φ角度.. 可以每30度展示一次。
祝好! Morten
ax.plot_surface(x_itp, y_itp, z_itp, rstride=1, cstride=1, facecolors=facecolors, linewidth=0.1)
我得到了很多的网格线。另一方面,如果我将“rstride”和“cstride”设置为更高的值,我的球体会变得丑陋。
然后我试图压缩一个 (此处可能有遗漏或错误,请根据上下文理解)
ax.plot_wireframe(x_itp, y_itp, z_itp, rstride=3, cstride=3)
在后面,但它只是位于有色球体的顶部..这意味着我可以看到线框模型的背面,然后是所有背后的表面绘图。有人试过这个吗?另一个选择是使用"Basemap",它可以创建一个漂亮的网格,但是我将不得不适应那个彩色的表面吗?!我的图表看起来像这样:
如果我用更高的"rstride"和"cstride"添加地图边缘,那么它看起来像这样:
norm = plt.Normalize()
facecolors = plt.cm.jet(norm(d_itp))

# surface plot
fig, ax = plt.subplots(1, 1, subplot_kw={'projection':'3d', 'aspect':'equal'})
ax.hold(True)
surf = ax.plot_surface(x_itp, y_itp, z_itp, rstride=4, cstride=4, facecolors=facecolors)
surf.set_edgecolors("black")
我想展示球体周围的θ和φ角度.. 可以每30度展示一次。
祝好! Morten