我正在尝试使用
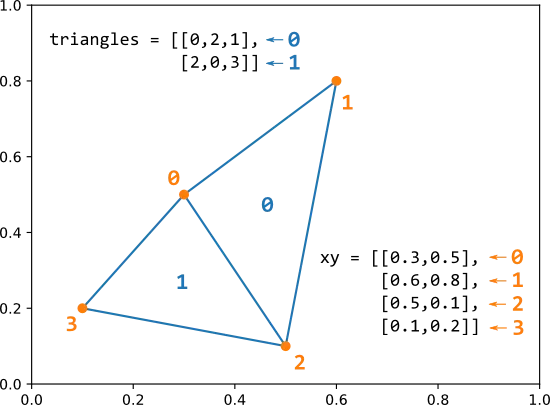
问题在于三角形需要一个(n,3)数组,其中n是三角形的数量。引用matplotlib.org上的页面上的话说“对于每个三角形,按逆时针顺序排列,其组成三角形的三个点的索引。”https://matplotlib.org/api/tri_api.html#matplotlib.tri.Triangulation。我无法确定如何以正确的形式创建数组,这就是我需要帮助的地方。感谢任何帮助。
到目前为止,我已经尝试了一些东西,但这是我最后一次尝试的样子:
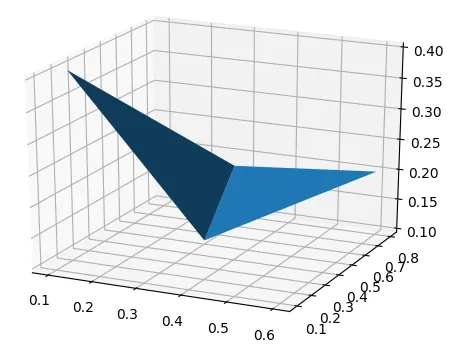
matplotlib.tri.Triangulation为matplotlib的plot_trisurf生成三角形。我想指定三角形而不是让Delaunay三角剖分来决定,因为在xz或yz平面中的某些情况下它无法正常工作。我不确定自己指定三角形是否能解决问题,但这似乎是一个值得尝试的好方法。问题在于三角形需要一个(n,3)数组,其中n是三角形的数量。引用matplotlib.org上的页面上的话说“对于每个三角形,按逆时针顺序排列,其组成三角形的三个点的索引。”https://matplotlib.org/api/tri_api.html#matplotlib.tri.Triangulation。我无法确定如何以正确的形式创建数组,这就是我需要帮助的地方。感谢任何帮助。
到目前为止,我已经尝试了一些东西,但这是我最后一次尝试的样子:
import matplotlib.pyplot as plt
import numpy as np
import matplotlib.tri as mtri

fig = plt.figure()
ax = fig.gca(projection='3d')

x1=0
x2=1
x3=1
x4=0

y1=0
y2=0
y3=2
y4=2

x=[]
y=[]
x.append(x1)
x.append(x2)
x.append(x3)
x.append(x4)
y.append(y1)
y.append(y2)
y.append(y3)
y.append(y4)
z=np.zeros(8)

triang = mtri.Triangulation(x, y, triangles=[[[x1,y1],[x2,y2],[x3,y3]],[[x3,y3],[x4,y4],[x2,y2]]])

ax.plot_trisurf(triang, z, linewidth=0.2, antialiased=True)

ax.view_init(45,-90)
ax.set_xlabel("X")
ax.set_ylabel("Y")
ax.set_zlabel("Z")
ax.set_aspect("equal")

fig.set_size_inches(8,8)

plt.show()