如何使用水平方向绘制Pandas的KDE图形

7
Pandas在绘图时提供了kind='kde'选项。在我的设置中,我更喜欢使用KDE密度图。另一个选项kind='histogram'提供了方向选项:orientation='horizontal',这对于我的需求是必要的。不幸的是,KDE图中没有orientation选项。
至少我认为是这样的,因为我得到了一个错误。
in set_lineprops
    raise TypeError('There is no line property "%s"' % key)
TypeError: There is no line property "orientation"

有没有一种直接的替代方法,可以像直方图一样轻松地水平绘制kde
import matplotlib.pyplot as plt
import numpy as np
import pandas as pd

plt.ion()

ser = pd.Series(np.random.random(1000))
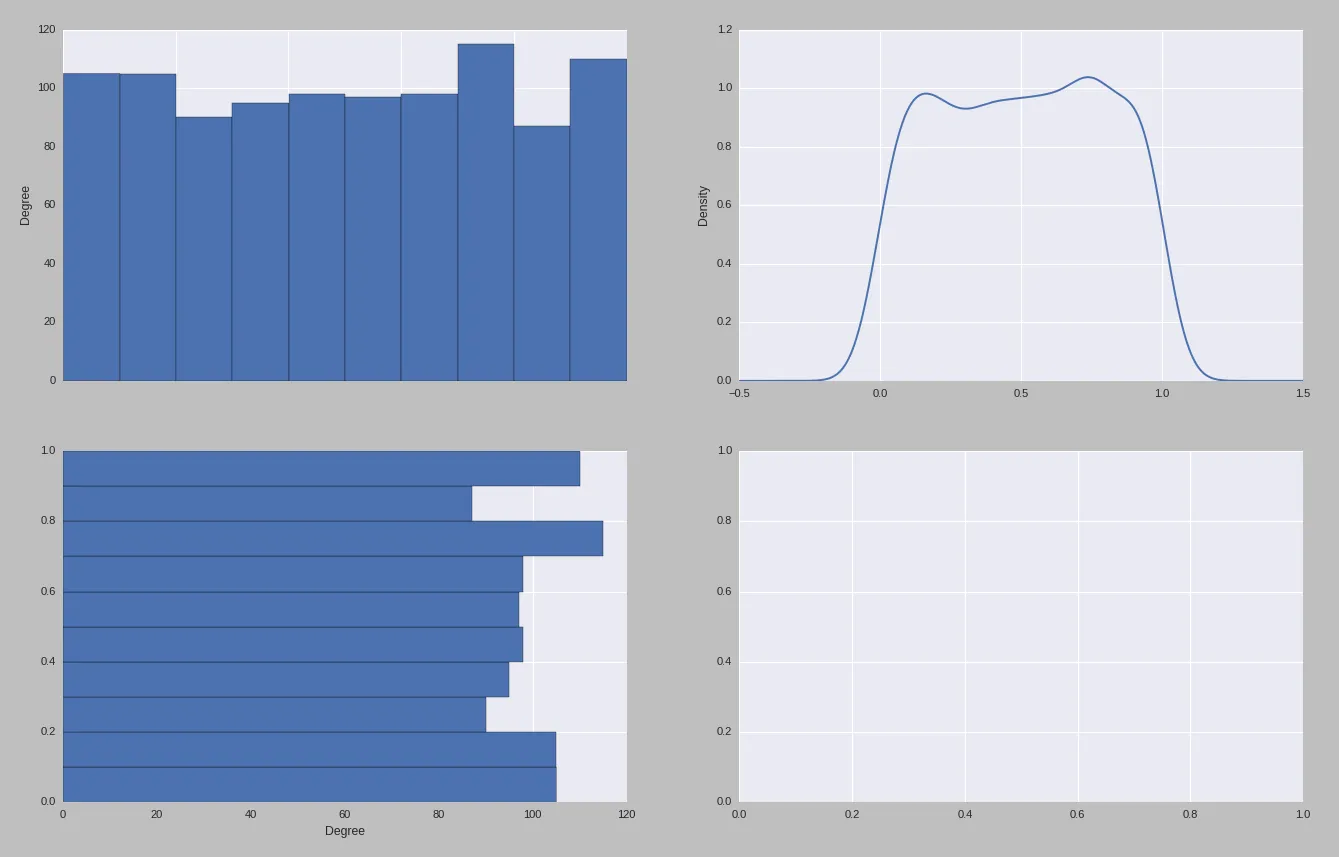
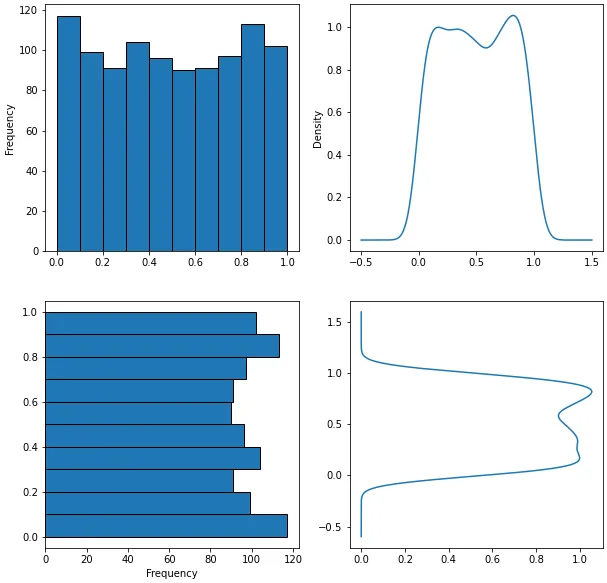
ax1 = plt.subplot(2,2,1)
ser.plot(ax = ax1, kind = 'hist')
ax2 = plt.subplot(2,2,2)
ser.plot(ax = ax2, kind = 'kde')
ax3 = plt.subplot(2,2,3)
ser.plot(ax = ax3, kind = 'hist', orientation = 'horizontal')

# not working lines below
ax4 = plt.subplot(2,2,4)
ser.plot(ax = ax4, kind = 'kde', orientation = 'horizontal')

enter image description here

1个回答

2
import pandas as pd
import numpy as np
import seaborn as sns
from scipy.stats import gaussian_kde

# crate subplots and don't share x and y axis ranges
fig, axes = plt.subplots(2, 2, figsize=(10, 10), sharex=False, sharey=False)

# flatten the axes for easy selection from a 1d array
axes = axes.flat

# create sample data
np.random.seed(2022)
ser = pd.Series(np.random.random(1000)).sort_values()

# plot example plots
ser.plot(ax=axes[0], kind='hist', ec='k')
ser.plot(ax=axes[1], kind='kde')
ser.plot(ax=axes[2], kind='hist', orientation='horizontal', ec='k')

# 1. create kde model
gkde = gaussian_kde(ser)

# 2. create a linspace to match the range over which the kde model is plotted
xmin, xmax = ax2.get_xlim()
x = np.linspace(xmin, xmax, 1000)

# 3. plot the values
axes[3].plot(gkde(x), x)

# Alternatively, use seaborn.kdeplot and skip 1., 2., and 3.
# sns.kdeplot(y=ser, ax=axes[3])

enter image description here


网页内容由stack overflow 提供, 点击上面的
可以查看英文原文,
原文链接