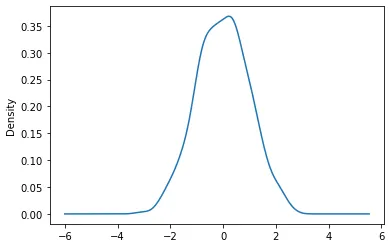
当我绘制pandas Series的密度分布图时,我使用以下代码:
.plot(kind='kde')
这个图形的输出数值是否可以获取?如果可以,如何获取?我需要绘制出来的数值。
.plot(kind='kde')
这个图形的输出数值是否可以获取?如果可以,如何获取?我需要绘制出来的数值。
.plot(kind='kde') 返回一个Axes对象。matplotlib.lines.Line2D对象的_x和_y方法访问原始值。
ax.get_children()来验证matplotlib.lines.Line2D是否位于[0]位置。._y和._x是“私有”方法,这在What is the meaning of single and double underscore before an object name?中有所讨论。python 3.12.0、pandas 2.1.1和matplotlib 3.8.0中进行了测试import pandas as pd
import matplotlib.pyplot as plt
import numpy as np
In [266]:
np.random.seed(2023) # for reproducibility
ser = pd.Series(np.random.randn(1000)) # or df = pd.DataFrame(np.random.randn(1000))
ax = ser.plot(kind='kde') # or ax = df.plot(kind='kde')
In [265]:
ax.get_children() # Line2D at index 0
Out[265]:
[<matplotlib.lines.Line2D at 0x2b10f8322d0>,
<matplotlib.spines.Spine at 0x2b10f7ff3e0>,
<matplotlib.spines.Spine at 0x2b10f69a300>,
<matplotlib.spines.Spine at 0x2b10db33a40>,
<matplotlib.spines.Spine at 0x2b10f7ff410>,
<matplotlib.axis.XAxis at 0x2b10f7ff530>,
<matplotlib.axis.YAxis at 0x2b10f69a2a0>,
Text(0.5, 1.0, ''),
Text(0.0, 1.0, ''),
Text(1.0, 1.0, ''),
<matplotlib.patches.Rectangle at 0x2b104c29f40>]
In [264]:
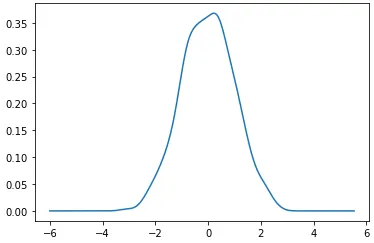
# get the values
x = ax.get_children()[0]._x
y = ax.get_children()[0]._y
plt.plot(x, y)
scipy.stats.gaussian_kde()函数,这就是pandas源代码中发生的事情。该函数的文档在这里:http://docs.scipy.org/doc/scipy/reference/generated/scipy.stats.gaussian_kde.html。请参见此链接:https://github.com/pydata/pandas/blob/master/pandas/tools/plotting.py#L284。对我来说,最佳答案不起作用。 以下代码适用于我。
xx = s.plot.density(color='orange', bw_method=0.1, alpha=1)
hist_x = xx.lines[0]._x
hist_y = xx.lines[0]._y
ax.get_children()对我来说是个重大突破。我不知道你可以这样做。 - O.rka