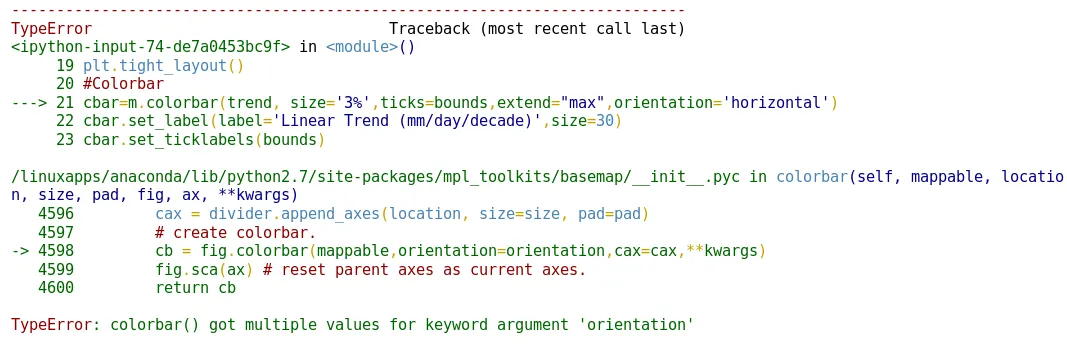
我有一个带basemap的图,并在其上添加了colormesh,colorbar设置为cbar。我想将colorbar方向设置为水平而不是垂直,但当我在extend='max'后在cbar=m.colorbar行中设置orientation='horizontal'时,我会收到以下错误消息:“colorbar() got multiple values for keyword argument 'orientation'”。
另一个问题上的某人解释了为什么会出现这种情况,但我实在无法理解答案或看到如何修复的解释。有人可以帮忙吗?我尝试使用plt.colorbar,但由于某种原因,它不接受我的刻度设置。
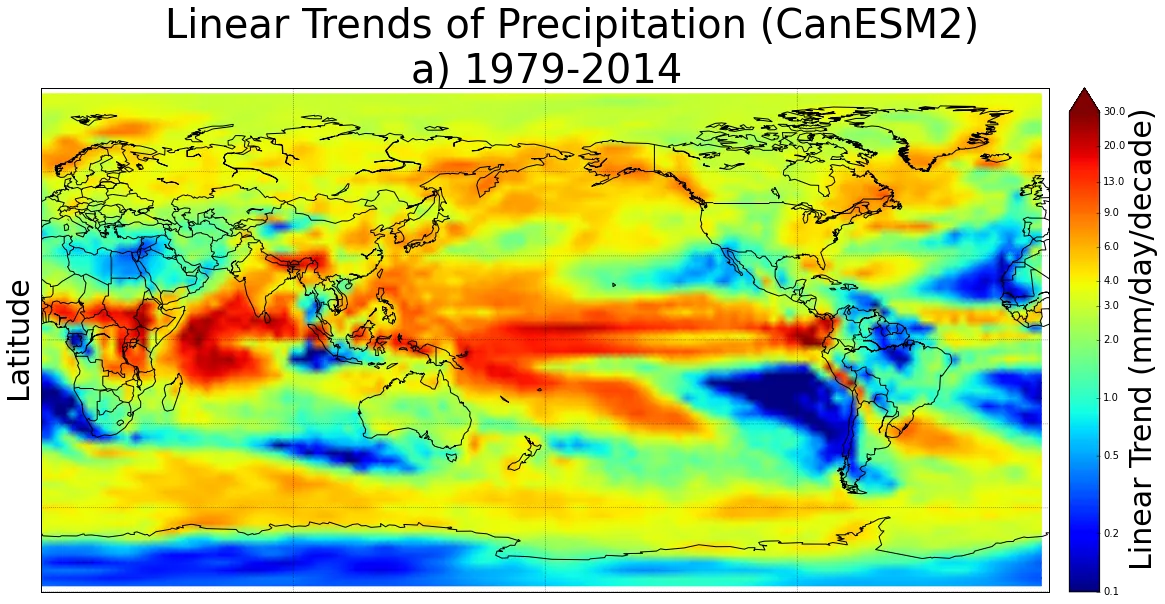
这是我的图像在更改之前的样子...
#Set cmap properties
bounds = np.array([0.1,0.2,0.5,1,2,3,4,6,9,13,20,30])
norm = colors.LogNorm(vmin=0.1,vmax=30) #creates logarithmic scale

#Create basemap
fig = plt.figure(figsize=(15.,10.))
m = Basemap(projection='cyl',llcrnrlat=-90,urcrnrlat=90,llcrnrlon=0,urcrnrlon=360.,lon_0=180.,resolution='c')
m.drawcoastlines(linewidth=1)
m.drawcountries(linewidth=1)
m.drawparallels(np.arange(-90,90,30.),linewidth=0.3)
m.drawmeridians(np.arange(-180.,180.,90.),linewidth=0.3)
meshlon,meshlat = np.meshgrid(lon,lat)
x,y = m(meshlon,meshlat)

#Plot variables
trend = m.pcolormesh(x,y,lintrends_36,cmap='jet', norm=norm, shading='gouraud')

#Set plot properties
plt.tight_layout()
#Colorbar
cbar=m.colorbar(trend, size='3%',ticks=bounds,extend="max") #THIS LINE
cbar.set_label(label='Linear Trend (mm/day/decade)',size=30)
cbar.set_ticklabels(bounds)
#Titles & labels
plt.suptitle('Linear Trends of Precipitation (CanESM2)',fontsize=40,y=0.962)
plt.title('a) 1979-2014',fontsize=40)
plt.ylabel('Latitude',fontsize=30)
plt.show()
当尝试更改方向时(其他所有代码保持不变)...
此时地图如下所示。
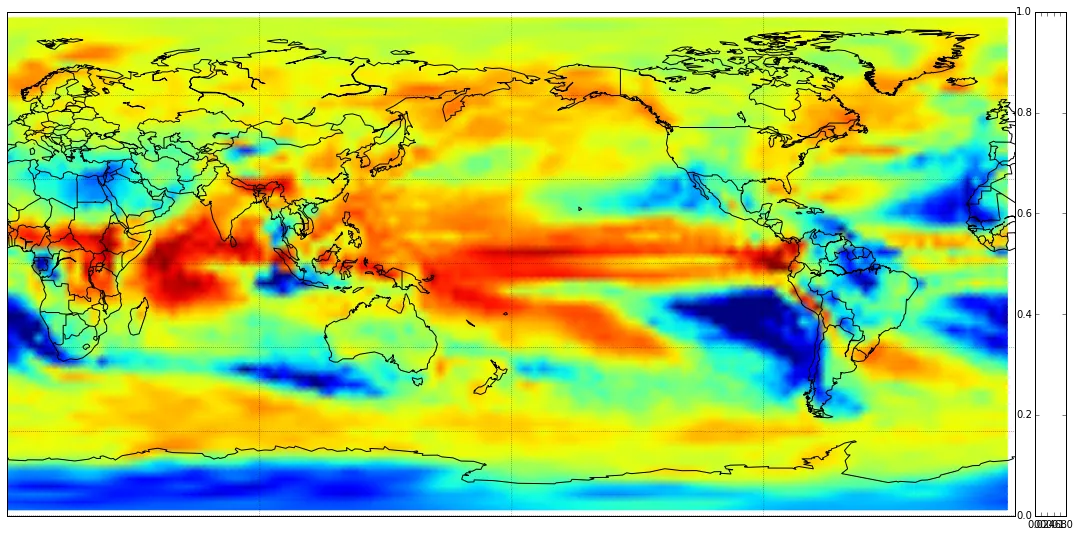
fig.colorbar而不是m.colorbar会怎样呢? - Paul Hcolorbar的声明在回溯中看起来没问题。此外,你发布的代码与回溯中显示的代码不同,在回溯中出现了orientation='horizontal',而在你发布的代码中没有 :) - Laurent S