我有以下Python代码来绘制一个表面等高线图:
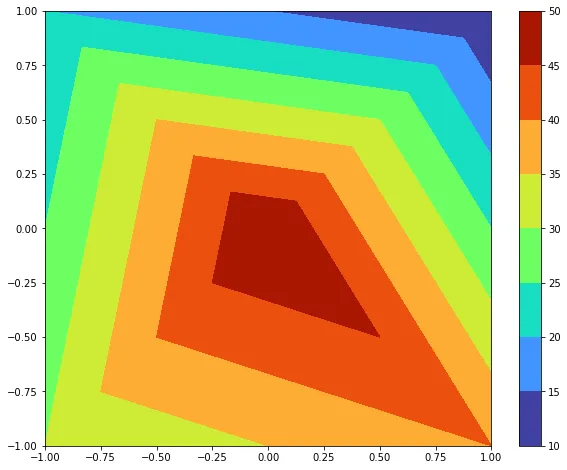
这样做会给我以下的图表:
import matplotlib.pyplot as plt
from matplotlib import cm
import pandas as pd

dx = {'1': 1, '2': -1, '3': -1, '4': 1, '5': 0}
x = pd.Series(data=dx, index=['1', '2', '3', '4', '5'])

dy = {'1': 1, '2': 1, '3': -1, '4': -1, '5': 0}
y = pd.Series(data=dy, index=['1', '2', '3', '4', '5'])

dT = {'1': 10, '2': 20, '3': 30, '4': 40, '5': 50}
T = pd.Series(data=dT, index=['1', '2', '3', '4', '5'])

plt.figure(figsize=(10,8))
plt.tricontourf(x, y, T, cmap=cm.turbo)
plt.colorbar(extend='both')
这将产生以下绘图:
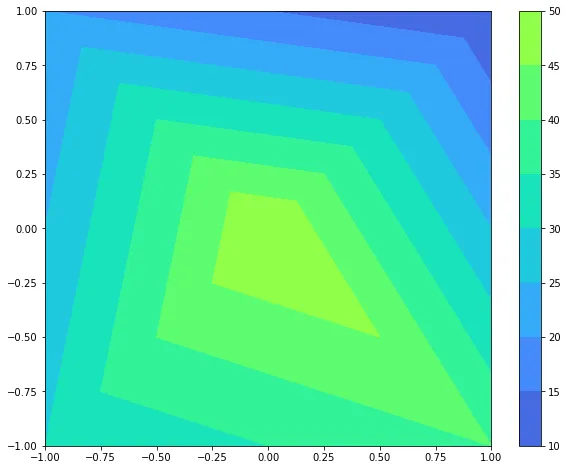
但是,我希望颜色条在0到100之间。
因此,我添加了以下内容
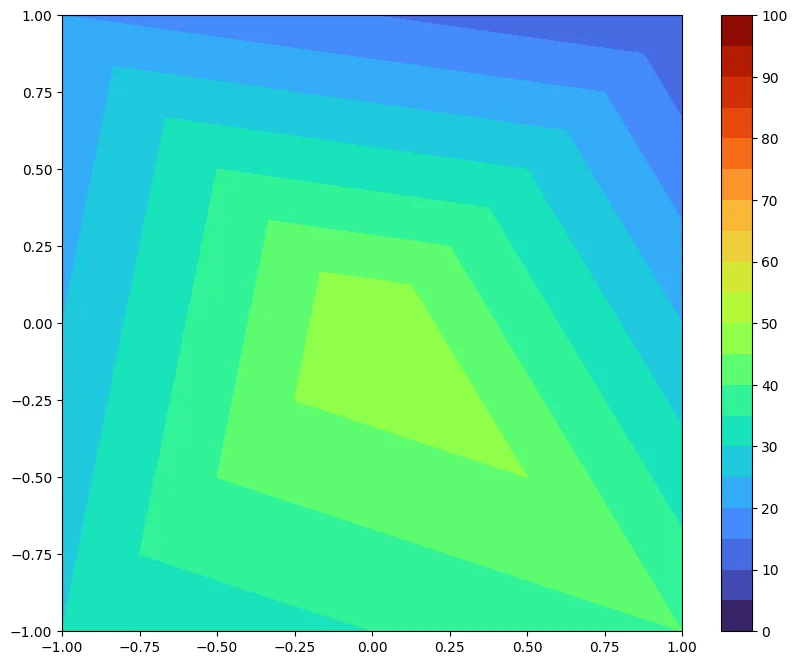
plt.clim(0,100)
这样做会给我以下的图表:
我怎样才能将色标图例的范围也改为0-100呢?
@JohanC- 我试过了,它并不完全奏效。它还会改变绘图的粒度,这并不是我想要的。请看下面:
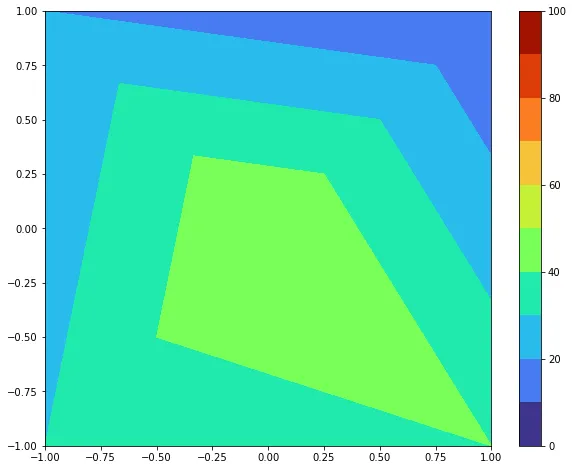
所以,我尝试了这个:
plt.tricontourf(x, y, T, cmap=cm.turbo,levels=np.arange(0,101,5))
我得到了这个结果(它没有显示顶部的100,尽管实际上存在):
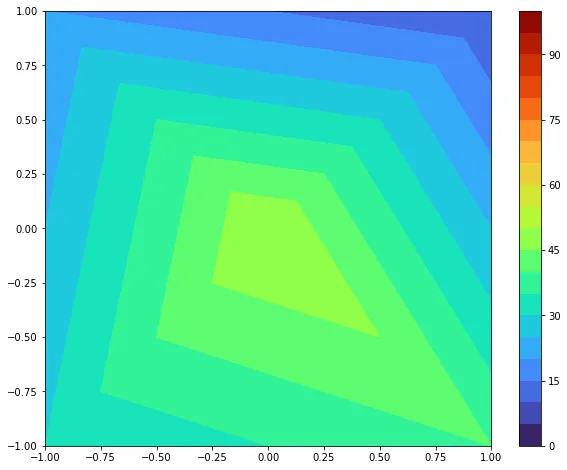
您好,能请您帮忙吗?我该如何强制打印显示终点标签呢?非常感谢!
plt.tricontourf(..., levels=np.arange(10,101,10))可以满足你的需求? - JohanC