这里有一个最简示例,可以生成一个图表来说明我的问题:
生成的图像如下所示:
如何在不改变图中的
我最初尝试使用
当我输入这个问题时,我有了这个想法(橡皮鸭子调试):
基本上,将
这样可以实现。
但是: 是否有一种直接控制
import matplotlib.pylab as plt
import matplotlib.mpl as mpl
import numpy as np
import random

data = [[random.random() for i in range(10)] for j in range(10)]

[XT, YT] = np.meshgrid(np.arange(1,10+1,1), np.arange(1,10+1,1))

cmap = mpl.cm.gray

fig, ax = plt.subplots()

CS = ax.contour(XT, YT, data,levels=np.arange(0,1+0.1,0.1),\
                cmap=cmap,linewidths=0.75)
CB = plt.colorbar(CS, ticks=np.arange(0,1+0.1,0.1))

plt.show()
生成的图像如下所示:
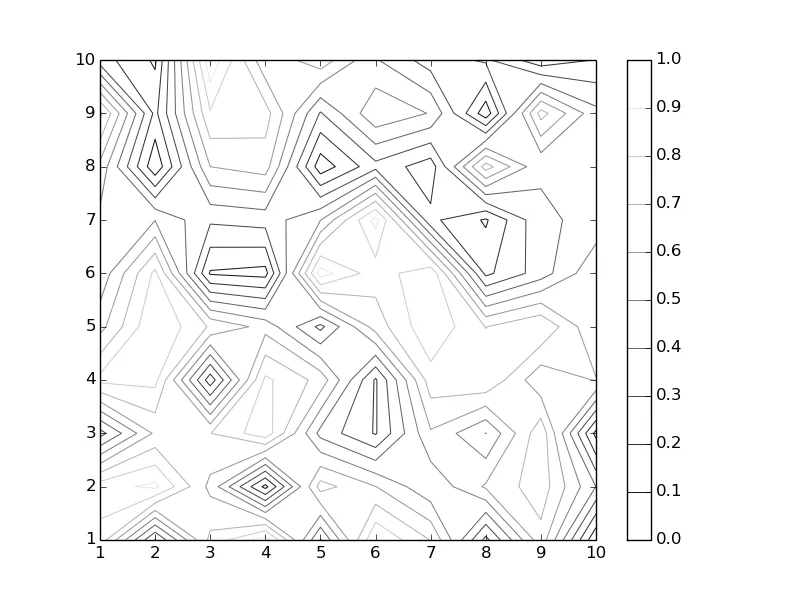
linewidths为0.75,但在colorbar中增加它们(以获得更好的可读性)。如何在不改变图中的
linewidths的情况下更改colorbar中的linewidths?我最初尝试使用
CB.collections,但是colorbar没有collections。此外,使用参数linewidths=4.0调用colorbar无法工作(这是一个未知的参数)。
评论当我输入这个问题时,我有了这个想法(橡皮鸭子调试):
CS = ax.contour(XT, YT, data,levels=np.arange(0,1+0.1,0.1),\
            cmap=cmap,linewidths=4.0)
CB = plt.colorbar(CS, ticks=np.arange(0,1+0.1,0.1))
plt.setp(CS.collections , linewidth=0.75)
基本上,将
linewidths的初始值设置为所需的colorbar级别,然后生成colorbar,之后使用collections在原始等高线上减小其线宽即可。这样可以实现。
但是: 是否有一种直接控制
colorbar中linewidths的方法?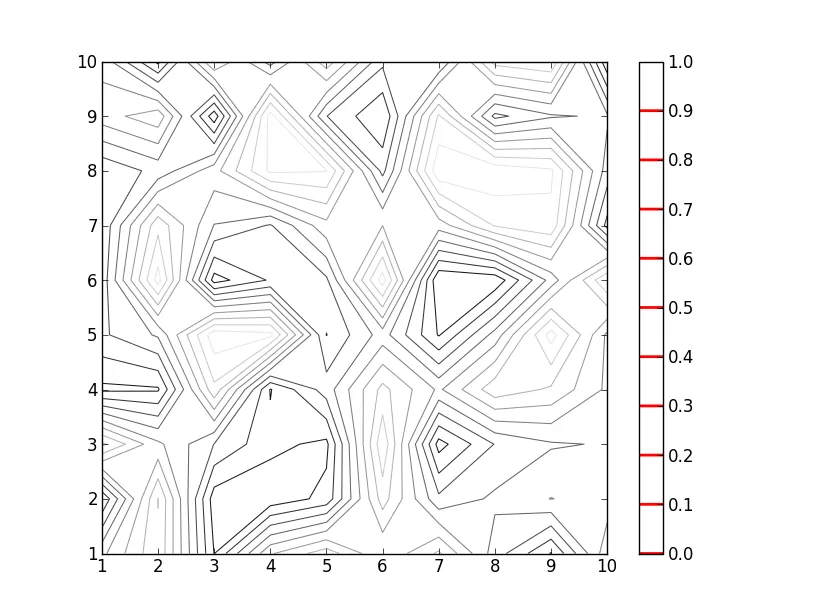
linewidths=4.0添加到 colorbar 中没有起作用,那么可能没有一种干净的方法(快速浏览代码似乎证实了这一点)。请参阅colorbar.ColorBar.add_lines。它似乎是专门设计来明确地 跟随 等高线图中的线宽度的。 - tacaswell