Matplotlib等高线图中颜色条的Python最小和最大范围

3

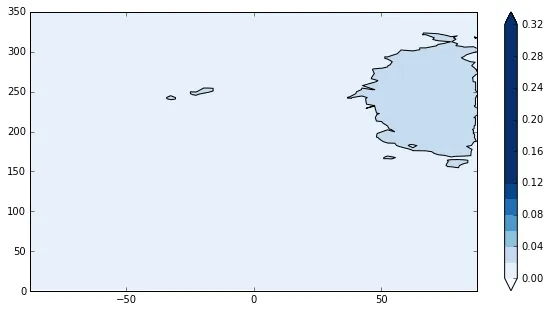
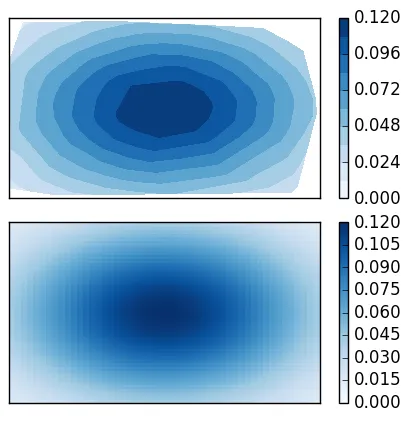
我想要将等高线图中的颜色条范围从0到0.12进行编辑,我尝试了几种方法但都没有成功。我一直得到的是完整的颜色条范围,直到0.3,这不是我想要的。

这是我的代码:

import numpy as np
import matplotlib.pyplot as plt
import matplotlib.tri as tri
triang = tri.Triangulation(x, y)

plt.tricontour(x, y, z, 15, colors='k')

plt.tricontourf(x, y, z, 15, cmap='Blues', vmin=0, vmax=0.12,\
                extend ='both')
plt.colorbar()

plt.clim(0,0.12)

plt.ylim (0.5,350)

plt.xlim(-87.5,87.5)

plt.show()

xyz都是只有一列且行数很多的数组。您可以在此处查看我的图形:

enter image description here


抱歉,这是哪个模块?是 matplotlib 吗?请打上标签以获得更好的回复。 - AbdealiJK
是的,这是matplotlib,谢谢你帮我加上它。(第一次在这里发问题!) - Fatma90
x、y和z是什么? - DavidG
x、y和z是大小相同的一维向量。 - Fatma90
1个回答

6

我认为这个问题确实是有意义的。 @Fatma90:在你的情况下,你需要提供一个工作示例,其中包括x、y和z。

无论如何,我们可以自己发明一些值。所以问题是,vmin和vmax被plt.tricontourf()简单地忽略了,我不知道有什么好的解决办法。

然而,这里有一个解决方法,手动设置levels

plt.tricontourf(x, y, z, levels=np.linspace(0,0.12,11), cmap='Blues' )

在这里,我们使用10个不同的级别,这看起来很好(一个问题可能是如果使用不同数量的级别,可能会出现漂亮的刻度标记)。

我提供一个工作示例以查看效果:

import numpy as np
import matplotlib.pyplot as plt

#random numbers for tricontourf plot
x = (np.random.ranf(100)-0.5)*2.
y = (np.random.ranf(100)-0.5)*2.
#uniform number grid for pcolor
X, Y = np.meshgrid(np.linspace(-1,1), np.linspace(-1,1))

z = lambda x,y : np.exp(-x**2 - y**2)*0.12

fig, ax = plt.subplots(2,1)

# tricontourf ignores the vmin, vmax, so we need to manually set the levels
# in this case we use 11-1=10 equally spaced levels.
im = ax[0].tricontourf(x, y, z(x,y), levels=np.linspace(0,0.12,11), cmap='Blues' )
# pcolor works as expected
im2 = ax[1].pcolor(z(X,Y), cmap='Blues', vmin=0, vmax=0.12 )

plt.colorbar(im, ax=ax[0])
plt.colorbar(im2, ax=ax[1])

for axis in ax:
    axis.set_yticks([])
    axis.set_xticks([])
plt.tight_layout()
plt.show()

这将产生:

这里输入图片描述


网页内容由stack overflow 提供, 点击上面的
可以查看英文原文,
原文链接