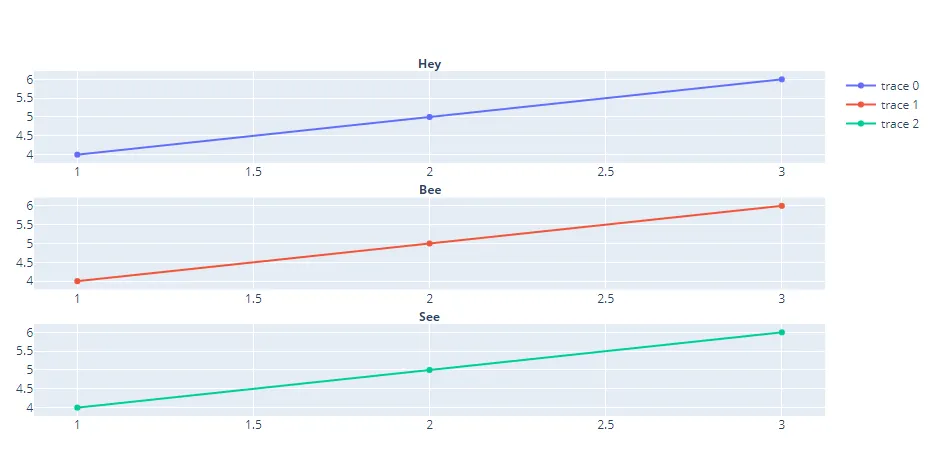
我有一个由子图组成的Plotly图表 -
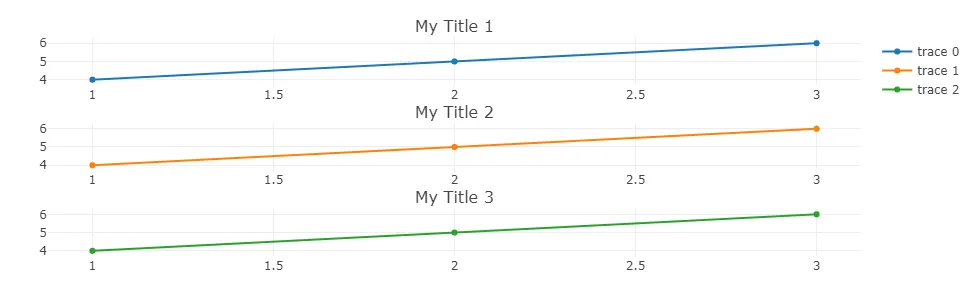
fig = make_subplots(
        rows=3, cols=1)

fig.add_trace(go.Scatter(x=[1, 2, 3], y=[4, 5, 6]), row=1, col=1)
fig.add_trace(go.Scatter(x=[1, 2, 3], y=[4, 5, 6]), row=2, col=1)
fig.add_trace(go.Scatter(x=[1, 2, 3], y=[4, 5, 6]), row=3, col=1)
我需要为每个子图添加标题,但是只能在创建图形并添加轨迹后才能添加。也就是说,不能在创建图形时添加标题 -
fig = make_subplots(
            rows=3, cols=1, subplot_titles=['a', 'b', 'c']
我可以通过 fig.update_layout 或类似的方式来实现吗?