我有一个由 Plotly Express 条形图包装的面向对象组,每个都有一个标题。如何将每个子图的标题与其绘图窗口的左侧左对齐? 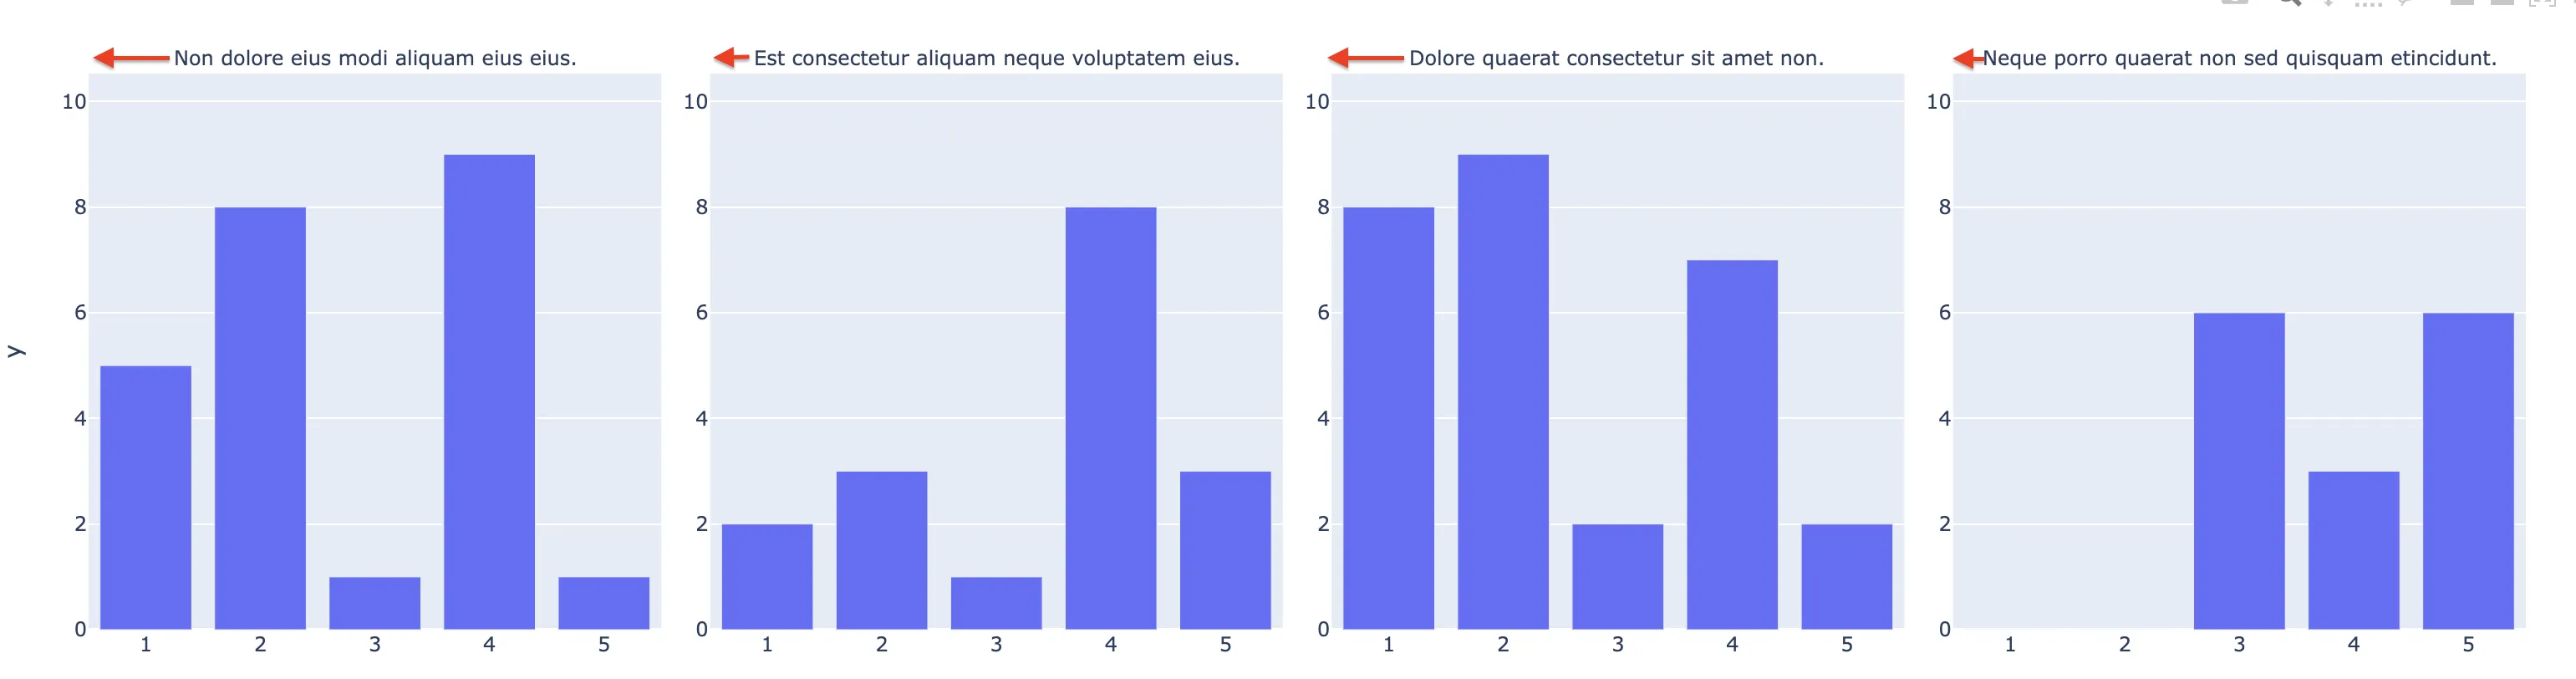
import lorem
import plotly.express as px
import numpy as np
import random
items = np.repeat([lorem.sentence() for i in range(10)], 5)
response = list(range(1,6)) * 10
n = [random.randint(0, 10) for i in range(50)]
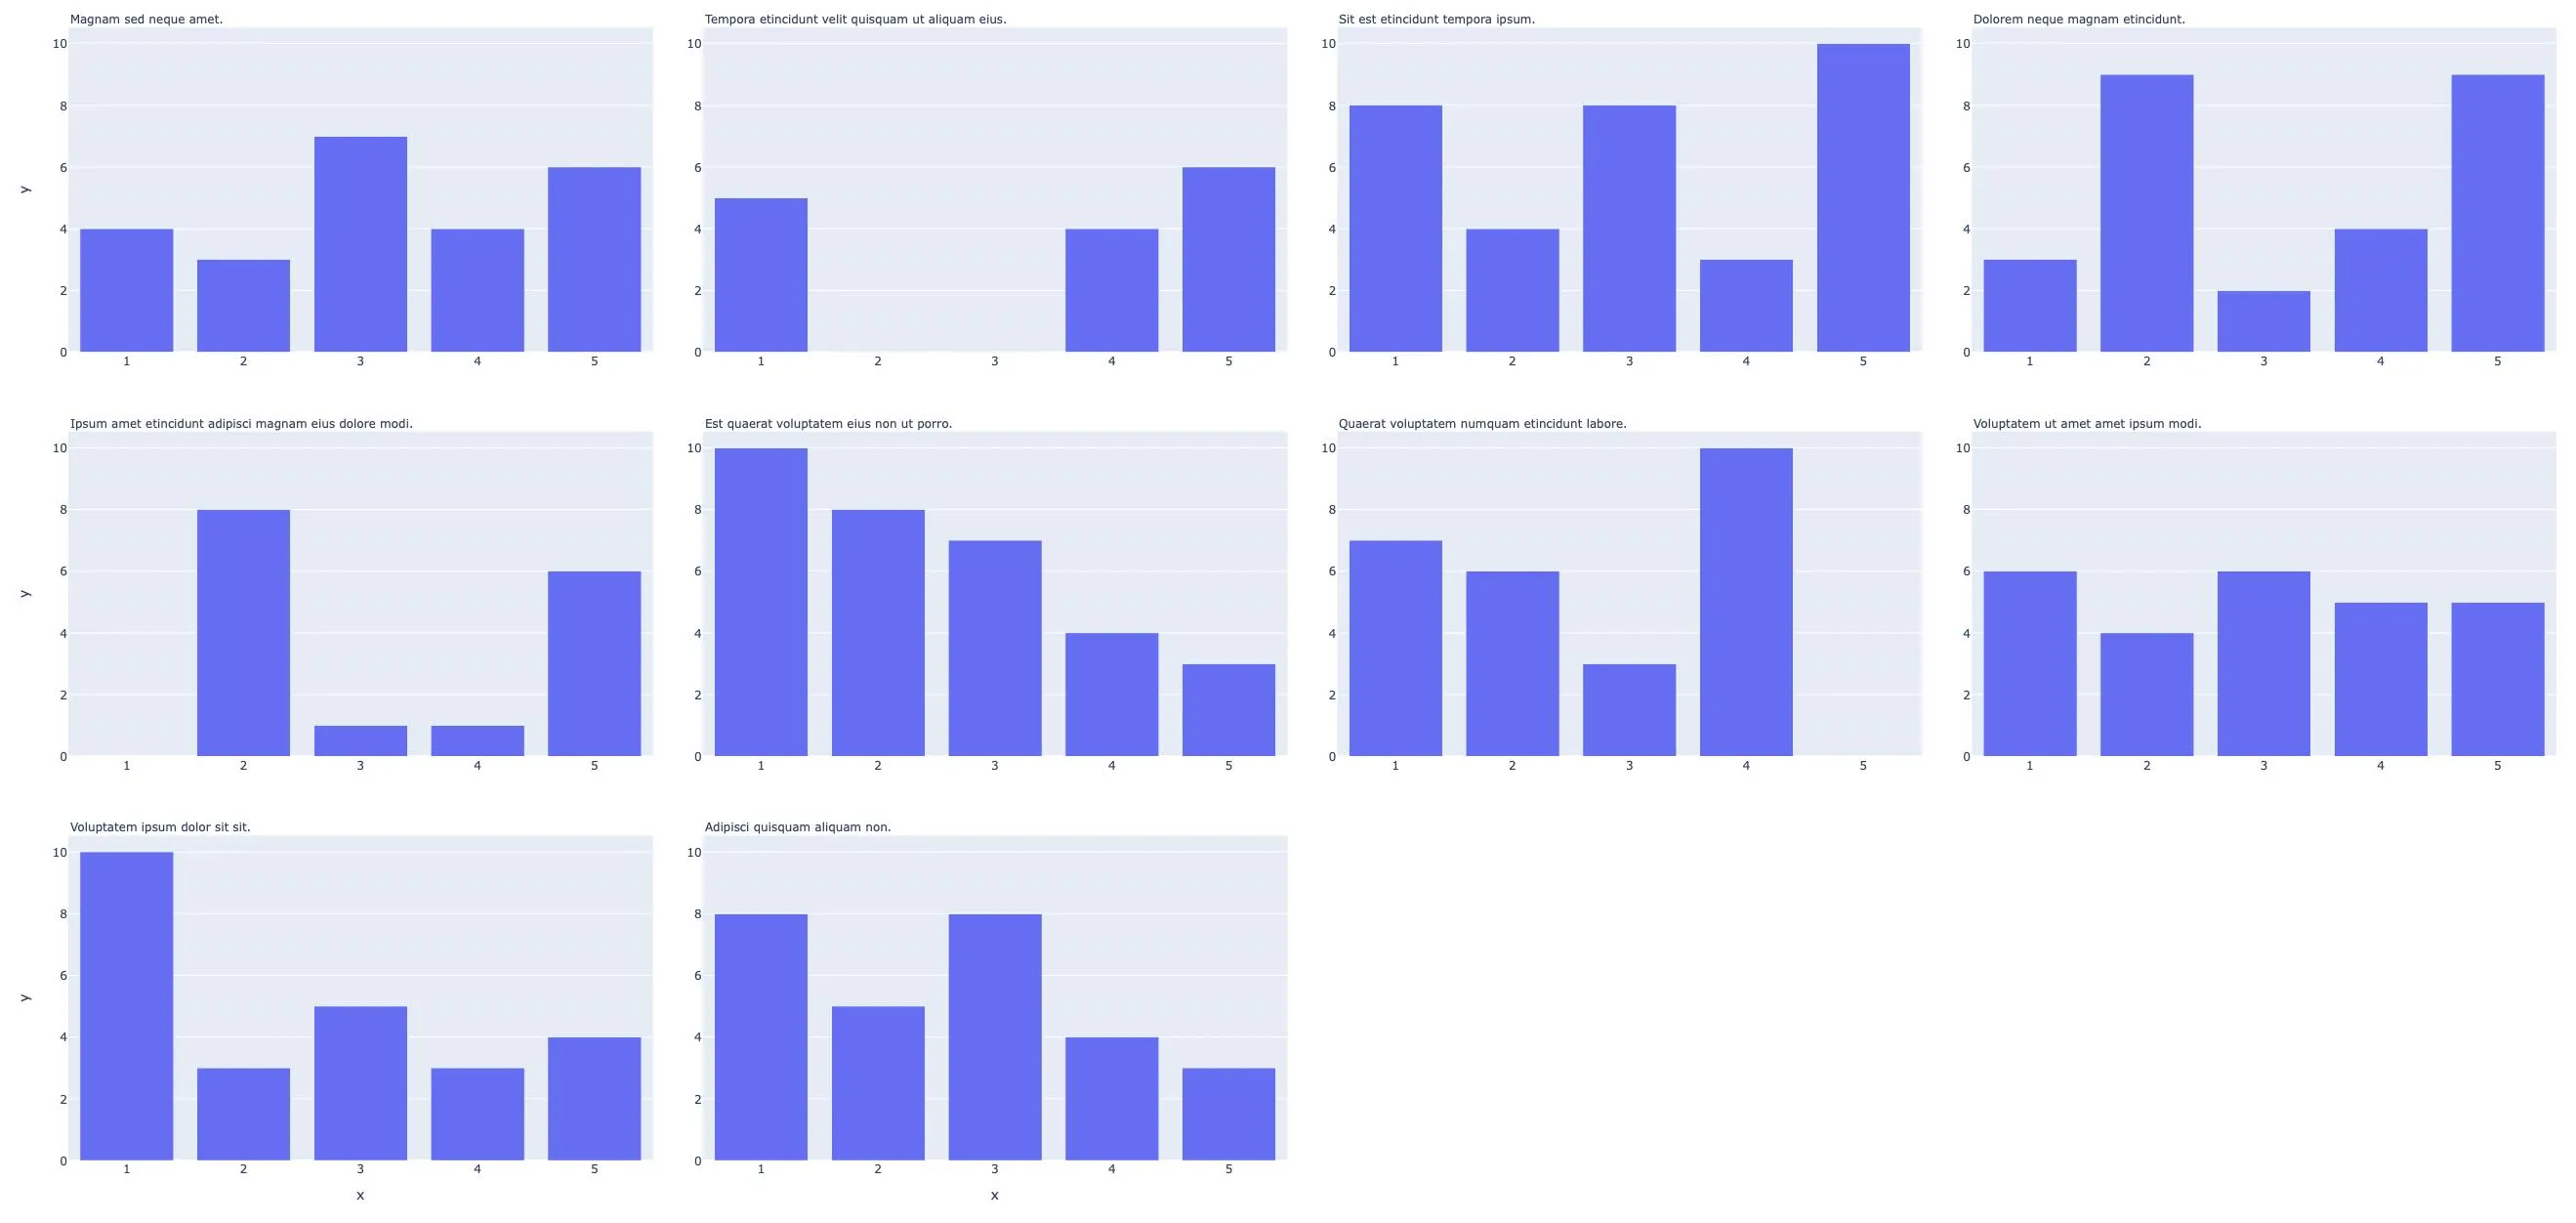
(
px.bar(x=response, y=n, facet_col=items, facet_col_wrap=4, height=1300)
.for_each_annotation(lambda a: a.update(text=a.text.split("=")[-1]))
.for_each_xaxis(lambda xaxis: xaxis.update(showticklabels=True))
.for_each_yaxis(lambda yaxis: yaxis.update(showticklabels=True))
.show()
)
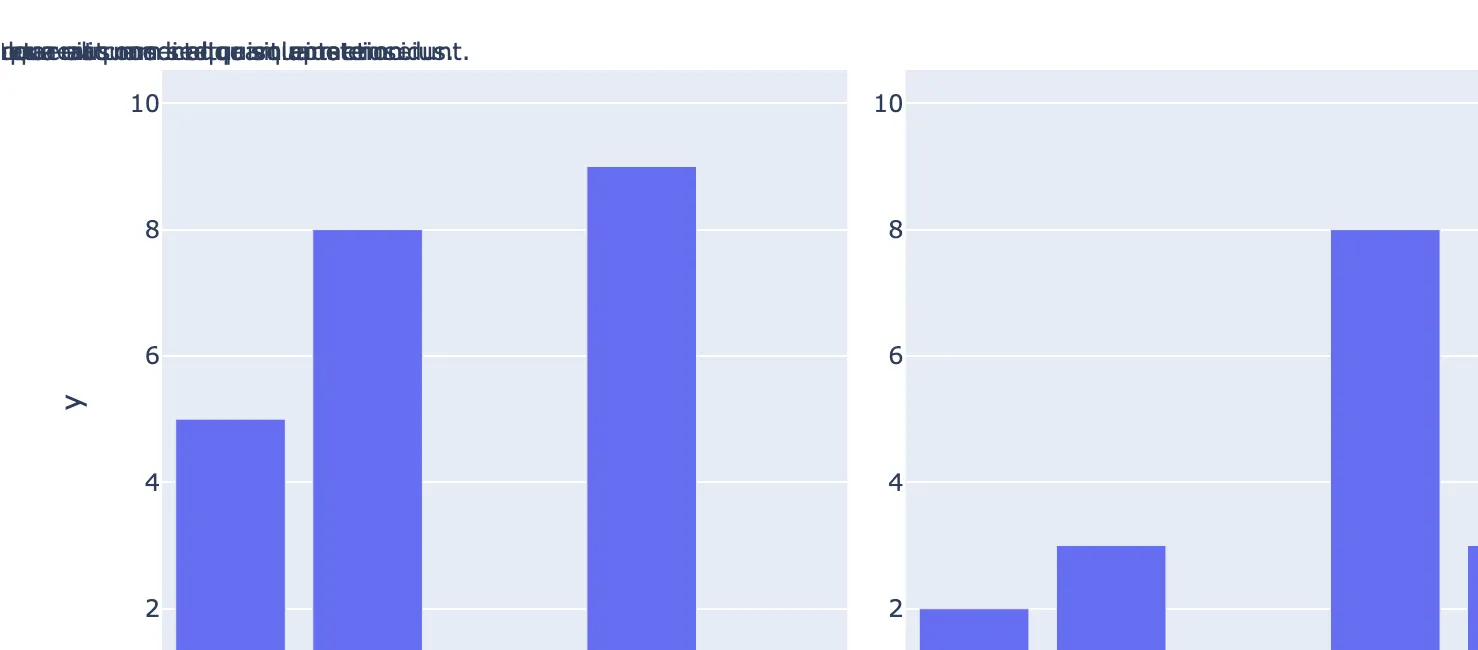
我尝试添加.for_each_annotation(lambda a: a.update(text=a.text.split("=")[-1], x=0)),但结果是:
facet_col_wrap传递到你分配给fig的部分中,然后稍后从fig中提取出来,并在需要它的地方进行传递(例如在remainder中)。我之所以这样问是因为将您的代码封装为一个方法并能够从传递给它的 fig 对象中了解facet_col_wrap将会很好。 - Tyler Rinkerfig.layout['xaxis'],fig.layout['xaxis2']...以及找出唯一区间的数量 - 我会相应地更新我的答案。 - Derek Ofig.layout中每个原始注释中唯一x值的数量-答案已经更新,让我知道这看起来是否不错! - Derek Opx.scatter图形上需要进行一次小的更新:使用len(fig.data)计算remainder和number_full_rows是不正确的,这导致最后一行的子图标题重叠在一起。这些代码需要更新为remainder = len(fig.layout.annotations) % facet_col_wrap和number_of_full_rows = len(fig.layout.annotations) // facet_col_wrap。希望这能帮助某人避免一点小麻烦。 - undefined