我知道如果想要设置所有子图的标题,可以在声明图形时完成。
import pandas as pd
import plotly.graph_objs as go
from plotly.subplots import make_subplots
fig = make_subplots(
###
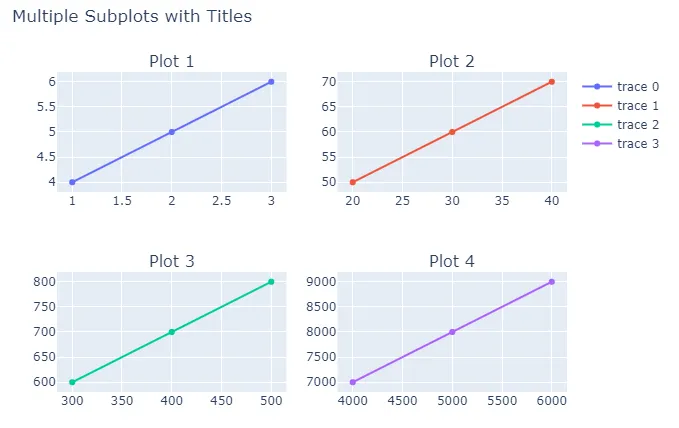
subplot_titles=['Plot 1', 'Plot 2', 'Plot 3', 'Plot 4', etc.]
)
然而,我在循环内部创建每个子图表,我认为在此过程中设置每个子图表的标题最容易。在我的情况下,我基于日期创建了一个groupby对象,然后循环遍历每个组(日期)数据帧。使用每个数据帧创建子图表,并且我希望标题是日期。我知道我可以在循环之前弄清楚这一点,并像平常一样设置subplot_titles,但似乎在循环中只需一行即可。如果有影响的话,我添加的跟踪是区域填充图。由于我的代码运行良好,因此我不会包含工作数据集-我只想知道需要添加哪行代码。
#Create groupby object, splitting data frame into separate data frames based on 'State'
death_counts_gbo = death_counts_by_week.groupby('End Week')

#Prepare subplots for choropleths
rows = 4
cols = 7
fig = make_subplots(
    rows=rows, cols=cols,
    specs = [[{'type': 'choropleth'} for c in np.arange(cols)] for r in np.arange(rows)],
)

#Graph each state's data
for i, (date, df) in enumerate(death_counts_gbo):
    fig.add_trace(go.Choropleth(
        locations=df['State Abbr'], # Spatial coordinates
        z = df['COVID-19 Deaths per 100k'].astype(float), # Data to be color-coded
        locationmode = 'USA-states', # set of locations match entries in `locations`
        colorscale = 'Reds',
        zmin = 0,
        zmax = 30,
        colorbar_title = "Deaths per 100k",
        text = date.strftime('%m-%d-%Y')
    ), row=i//7+1, col=i%7+1)
    ### This is where I'd like to set the subplot's title to 'date' ###

# Set title of entire figure
# Set each subplot map for the USA map instead of default world map
# Set each subplot map's lake color to light blue
fig.update_layout(
    title_text = 'COVID-19 Deaths per 100k at week ending',
    **{'geo' + str(i) + '_scope': 'usa' for i in [''] + np.arange(2,len(death_counts_gbo)+1).tolist()},
    **{'geo' + str(i) + '_lakecolor': 'lightblue' for i in [''] + np.arange(2,len(death_counts_gbo)+1).tolist()},
)

fig.show()
编辑:对于我的示例,我可以在创建图形时使用以下kwarg设置子图标题:
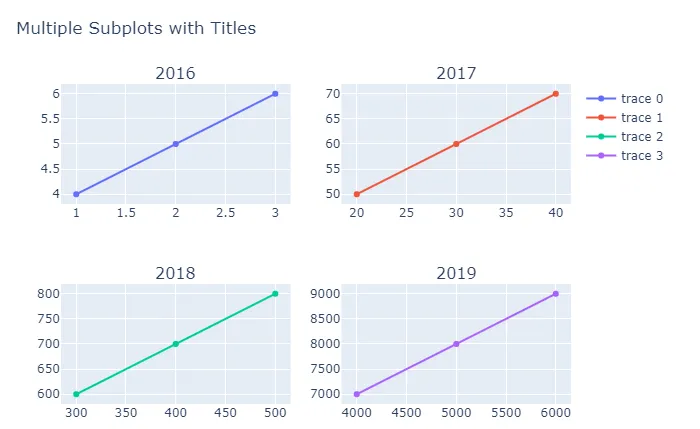
subplot_titles = [date.strftime('%m-%d-%Y') for date in list(death_counts_gbo.groups.keys())]
然而,为了自己的知识增长,如果我将来遇到更复杂的情况需要确定副标题,我仍然想知道如何在循环/图形声明后设置它。
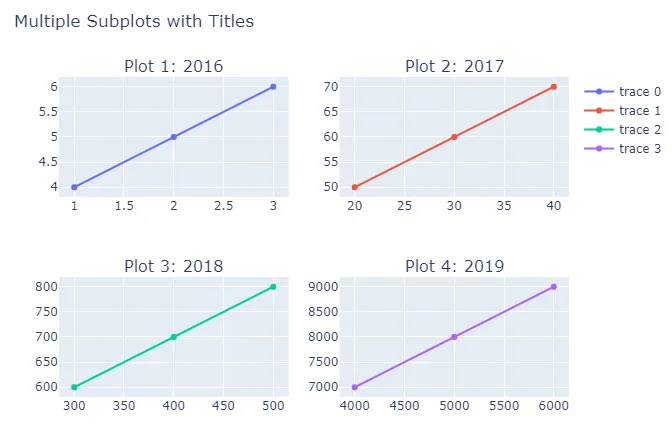
编辑2:感谢@rpanai提供的解决方案,虽然这需要改变我的make_subplots声明,并且还需要在循环中添加一行代码。他告诉我,副标题是存储在fig.layout.annotations中的注释,可以向其中提供副标题列表,但计算适当的x和y坐标可能会很麻烦。为了解决这个问题,我创建了临时副标题,并强制make_subplots计算x和y坐标。然后我在循环中更新了文本。
更新后的make_subplots图形声明(添加了subplot_titles):
fig = make_subplots(
    rows=rows, cols=cols,
    specs = [[{'type': 'choropleth'} for c in np.arange(cols)] for r in np.arange(rows)],
    subplot_titles = ['temp_subtitle' for date in np.arange(len(death_counts_gbo))]
)
一行代码 (for循环的第一行):
fig.layout.annotations[i]['text'] = date.strftime('%m-%d-%Y')
make_subplots中声明了子图标题,则它们将存储为fig.layout.annotations。我认为可以通过在for循环期间创建一个annotations列表来复制它,但我不认为值得为每个注释处理x和y位置。 - rpanaimake_subplots调用中添加一个临时字幕列表,以便它可以为我计算x和y位置。 - wex52创建一个有2x2个子图和随机名称的图形
figure_pl = make_subplots(rows=2, cols=2, start_cell="bottom-left", subplot_titles=("randname0","randname1","randname2", "randname3"))# 逐步更改名称new_names = [new_name0,new_name1,new_name2,new_name3]for i, new_name in enumerate(new_names):figure_pl.layout.annotations[i]["text"] = new_name- Arvind Kumarfigure_pl.layout并查找定义上述条目的字典条目。 - Contango